What's new?
In this release we have added more capabilities to port management and add more statistic into the dashboard.
Port management
Enhanced port information and attributes
Now GUI provides enhanced information of a port and capability to change NIC attributes: such as Multicast, Promiscuous mode, Flow control and etc. The "Service Mode" also can be managed from the GUI and there is an capability to Reset port.

Port configuration
There is no need to connect to TRex host and run trex-console app to configure port in L2 or L3 mode. GUI provides simple way to do it. Open "Configuration" tab, specify required SRC and DST parameters and click on "Apply" button. In case of L3 configuration application will automatically do ARP resolution for DST address.

Hardware counters
If you have real NIC you probably need to see hardware counters for debugging purposes. You can see them in "Hardware counters" tab. By default non-zero counters are visible. If you need to find certain counter you can specify it's name in the filter and "Pin" interested one and see the value despite on filter options.

Dashboard
Global statistic and new port selector
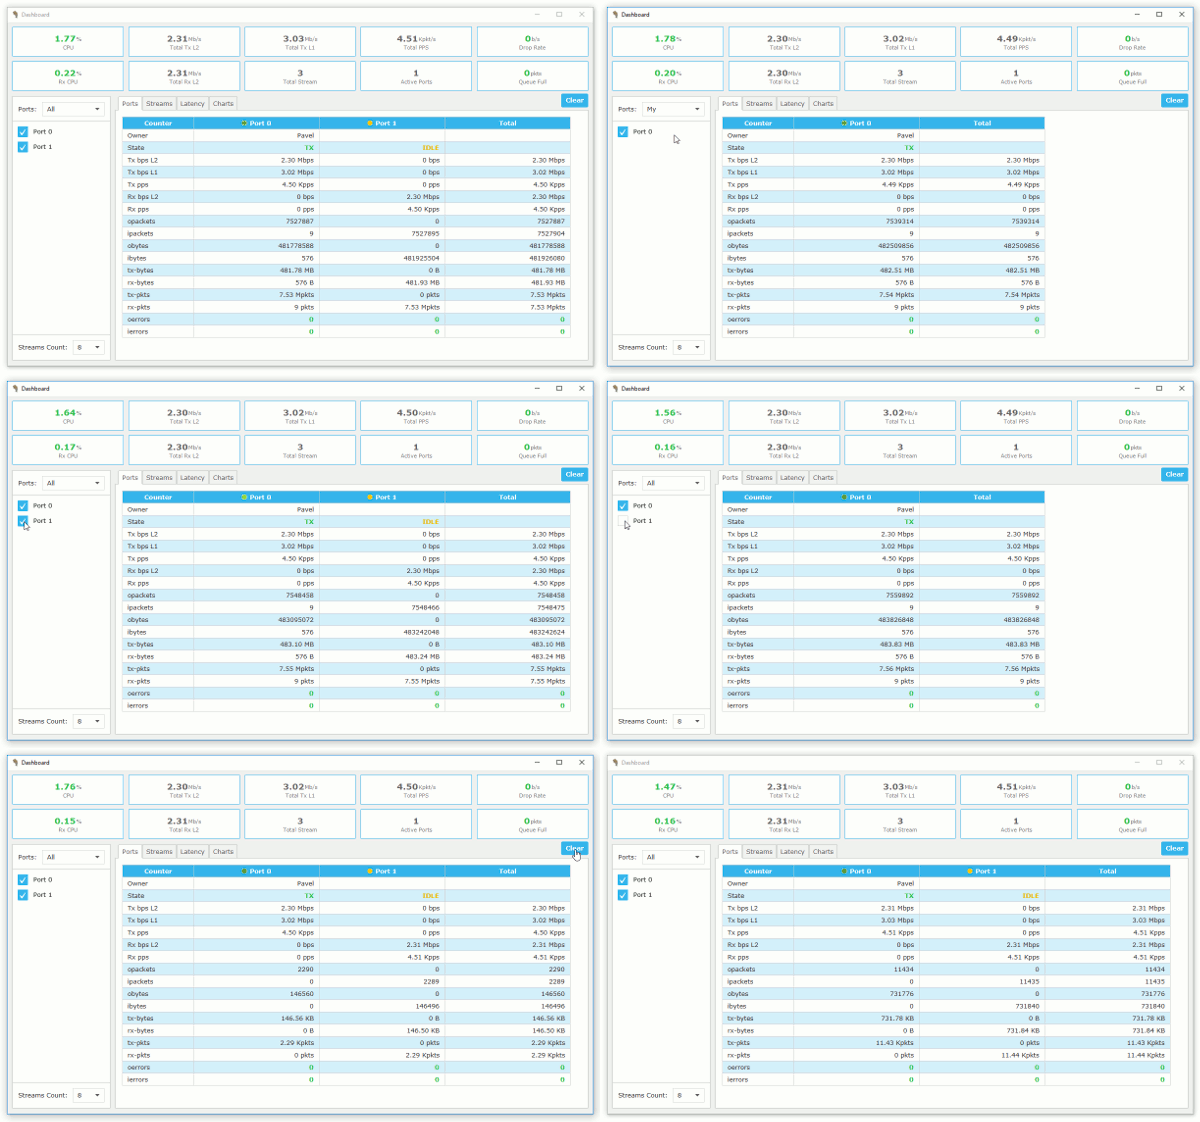
At the top of the dashboard you can see updated global statistics panel. Now global statistics contains ten panels with most interesting counters. Four of them have a color indicator which is green if value is good and red if it is not. It are "CPU", "Rx CPU", "Drop Rate" and "Queue Full". For the "CPU" and "Rx CPU" a good value threshold is 85%, for the "Drop Rate" and "Queue Full" it is 0.
Port selector become more flexible. Now it allows to specify a certain set of ports.

Streams tab
Streams tab displays detailed information per stream.

Latency
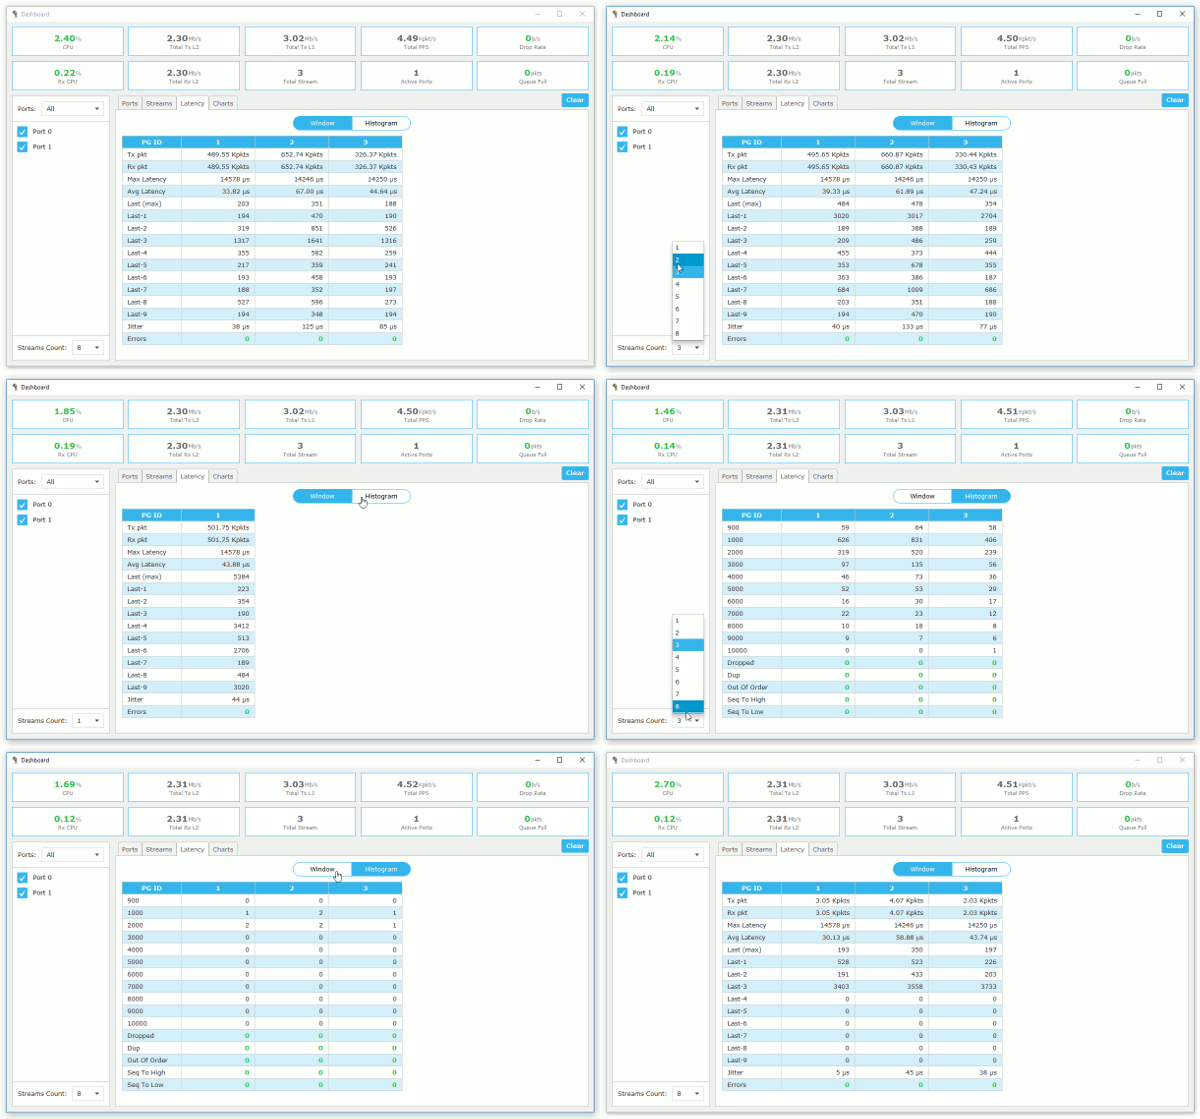
Latency window table represents detail information about the last ten temporary max latencies, jitter, max latency, avg latency and common information about the errors. Errors row has color indicator with good value threshold equals to 0.
Latency histogram table represents detail information about the latencies and errors. All error rows have color indicator with good value threshold equals to 0.

Charts
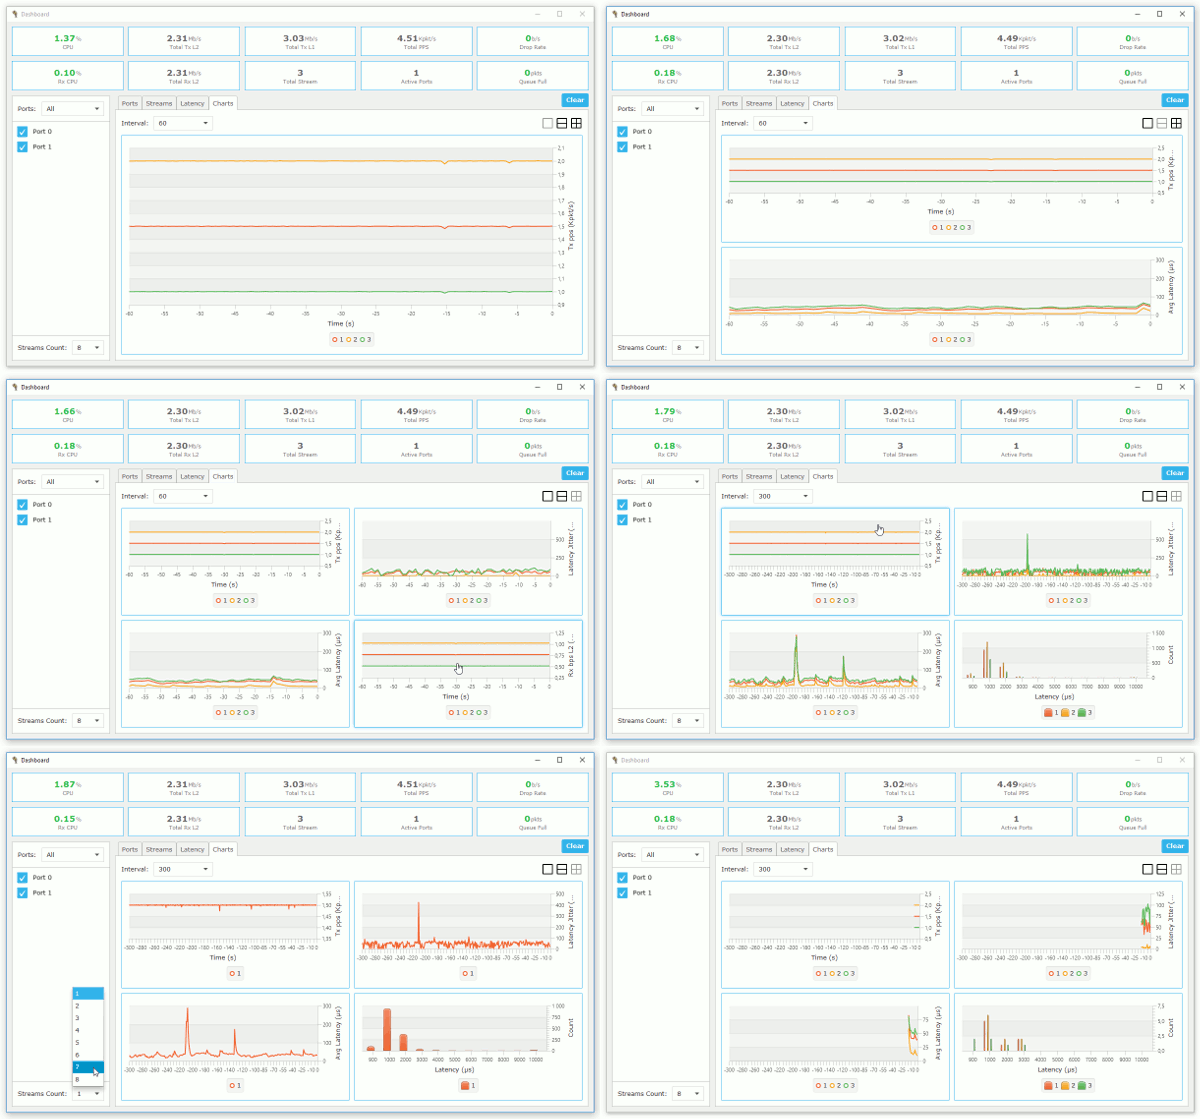
Also user can see stream's statistic in a charts which are more informative and handy. Multi-tile layout allows to see several statistics and compare them.

Installation
As it always you need a TRex instance. Here is TRex installation guide.
Windows build - trex-stateless-gui-3.2.exe
MAC OS builds - trex-stateless-gui-3.2.dmg trex-stateless-gui-3.2.pkg
Linux and others - trex-stateless-gui-3.2.tgz
What's else?
Besides enhanced UI/UX and bugfixes we have improvement performance and decrease memory consumption.
What's next?
The most desirable feature is Packet Capturing so we plan to add capability in the next release. Also Port/Stream selector will be enhanced. User will be able easy to select required stream from the hundreds or thousands other ones.
Please left in comments what feature should be added in the next release. So we can see needs of the real users.
Links:
