Turn on suggestions
Auto-suggest helps you quickly narrow down your search results by suggesting possible matches as you type.
Showing results for
- Cisco Community
- Technology and Support
- Data Center and Cloud
- Data Center and Cloud Blogs
- Announcing a New CVD: FlexPod Express with Cisco UCS Mini and Citrix XenDesktop 7.6 with Cisco Nexus...
2864
Views
11
Helpful
1
Comments
Options
- Subscribe to RSS Feed
- Mark as New
- Mark as Read
- Bookmark
- Subscribe
- Printer Friendly Page
- Report Inappropriate Content
10-23-2015
01:45 PM
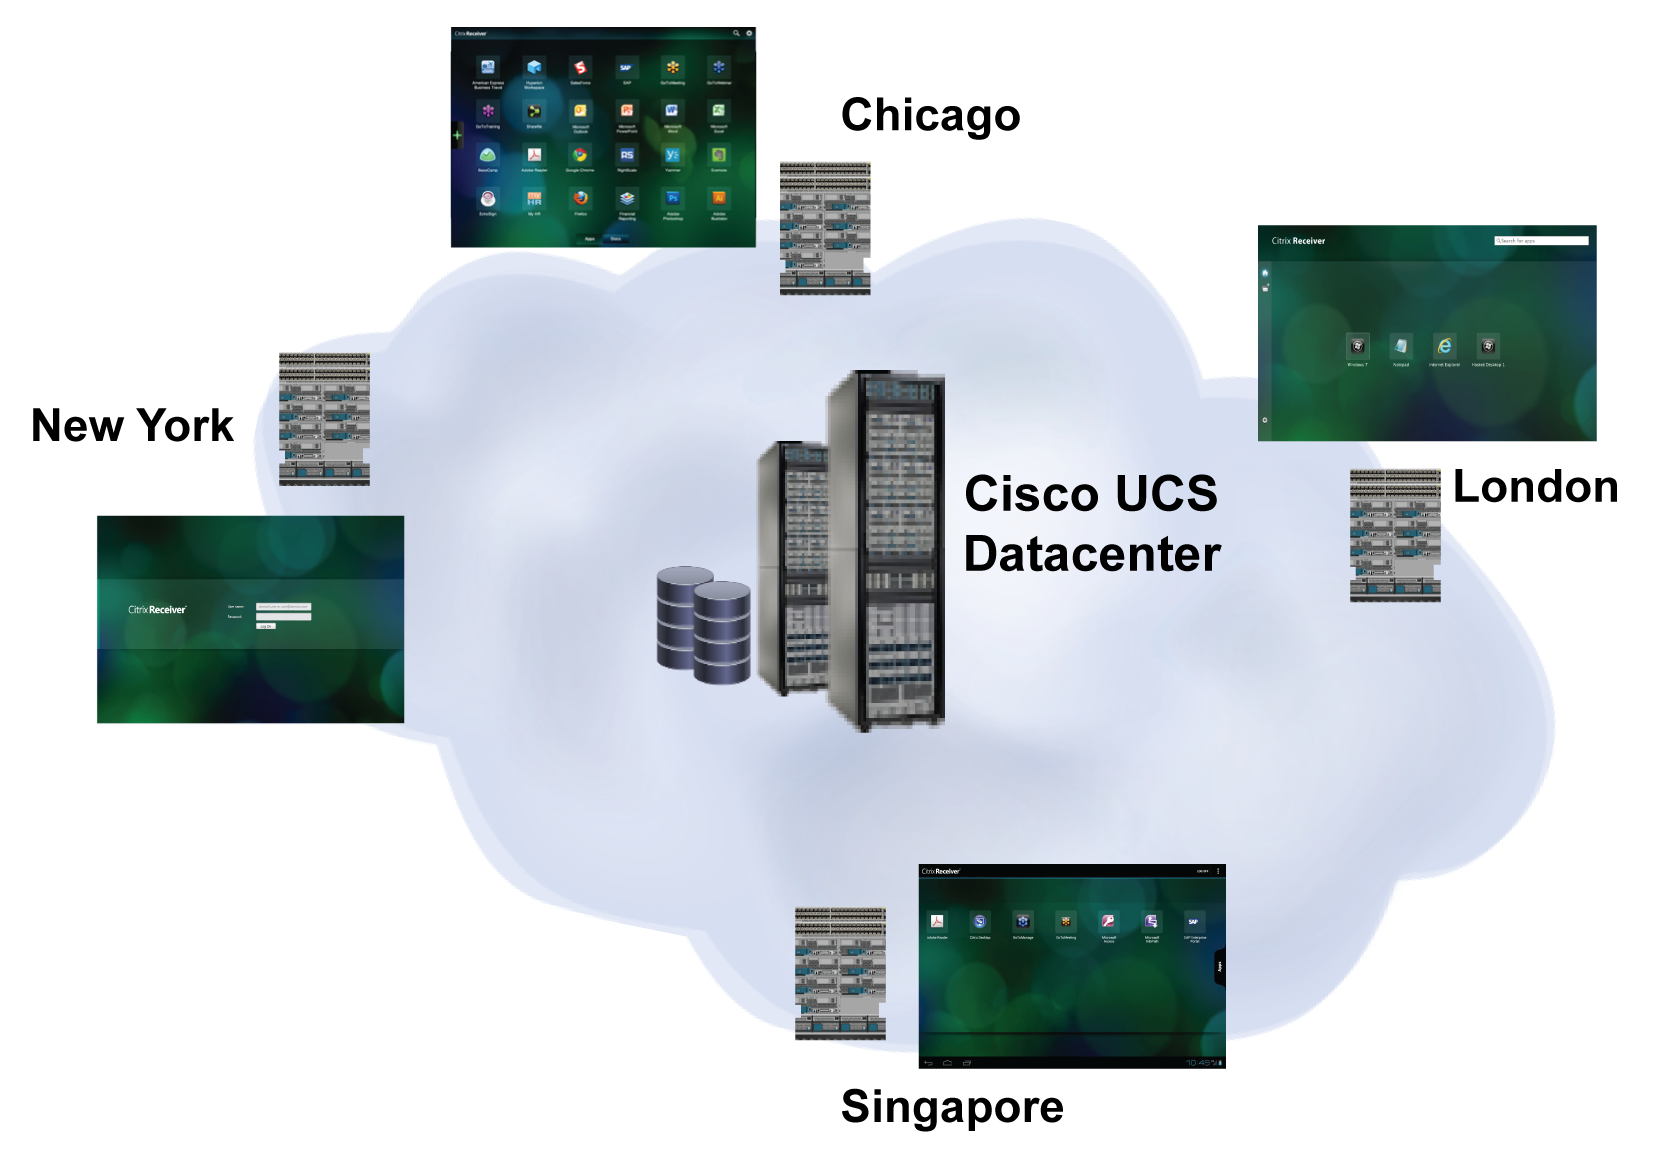
For companies that have geographically dispersed offices such as remote offices/branch offices (ROBOs) or other satellite locations, a turnkey solution for desktop virtualization can speed deployment at the enterprise edge. A new Cisco Validated Design (CVD) for Citrix XenApp and XenDesktop uses a predesigned, self-contained platform—the FlexPod Express with Cisco UCS Mini—that makes it easy to provision reliable desktops and applications from 350 to 700 users. The FlexPod Express, co-designed by Cisco and NetApp, integrates compute servers, networking fabric, and hybrid storage components, creating a standalone, drop-in VDI/SBC solution that can be installed at remote sites and yet managed centrally.
A Flexible Turnkey Solution
FlexPod Express with Cisco UCS Mini is the underlying building block that simplifies ROBO deployments while supporting density growth and proven mixes of XenApp and XenDesktop workloads. While FlexPod provides a cookie-cutter solution, this CVD demonstrates how a turnkey solution can also be quite versatile. Each deployment shares a common architecture, component design, configuration procedures, and management. At the same time configurations can scale and expand to accommodate greater user densities for hosted shared desktops (RDS) or hosted pooled virtual desktops (VDI). Every ROBO deployment follows the same architectural design but scales to facilitate site-specific RDS/VDI combinations. This excellent scalability can also benefit small and mid-sized businesses—they can start small and grow from 350 to as many as 700 users.
The CVD describes a base 4-blade FlexPod with Cisco UCS Mini configuration supporting 350 users (150 RDS and 200 VDI users). Cisco UCS B200 M4 Blade Servers were added to the base configuration to support workload expansion and larger densities. All configurations followed a fault-tolerant N+1 design for infrastructure and RDS/VDI VMs. To size and validate workload combinations, we conducted single and multiple blade server scalability tests using Login VSI software. The complete FlexPod CVD documents the step-by-step procedures used to create the test environment and includes all of the test results, which are highlighted here.
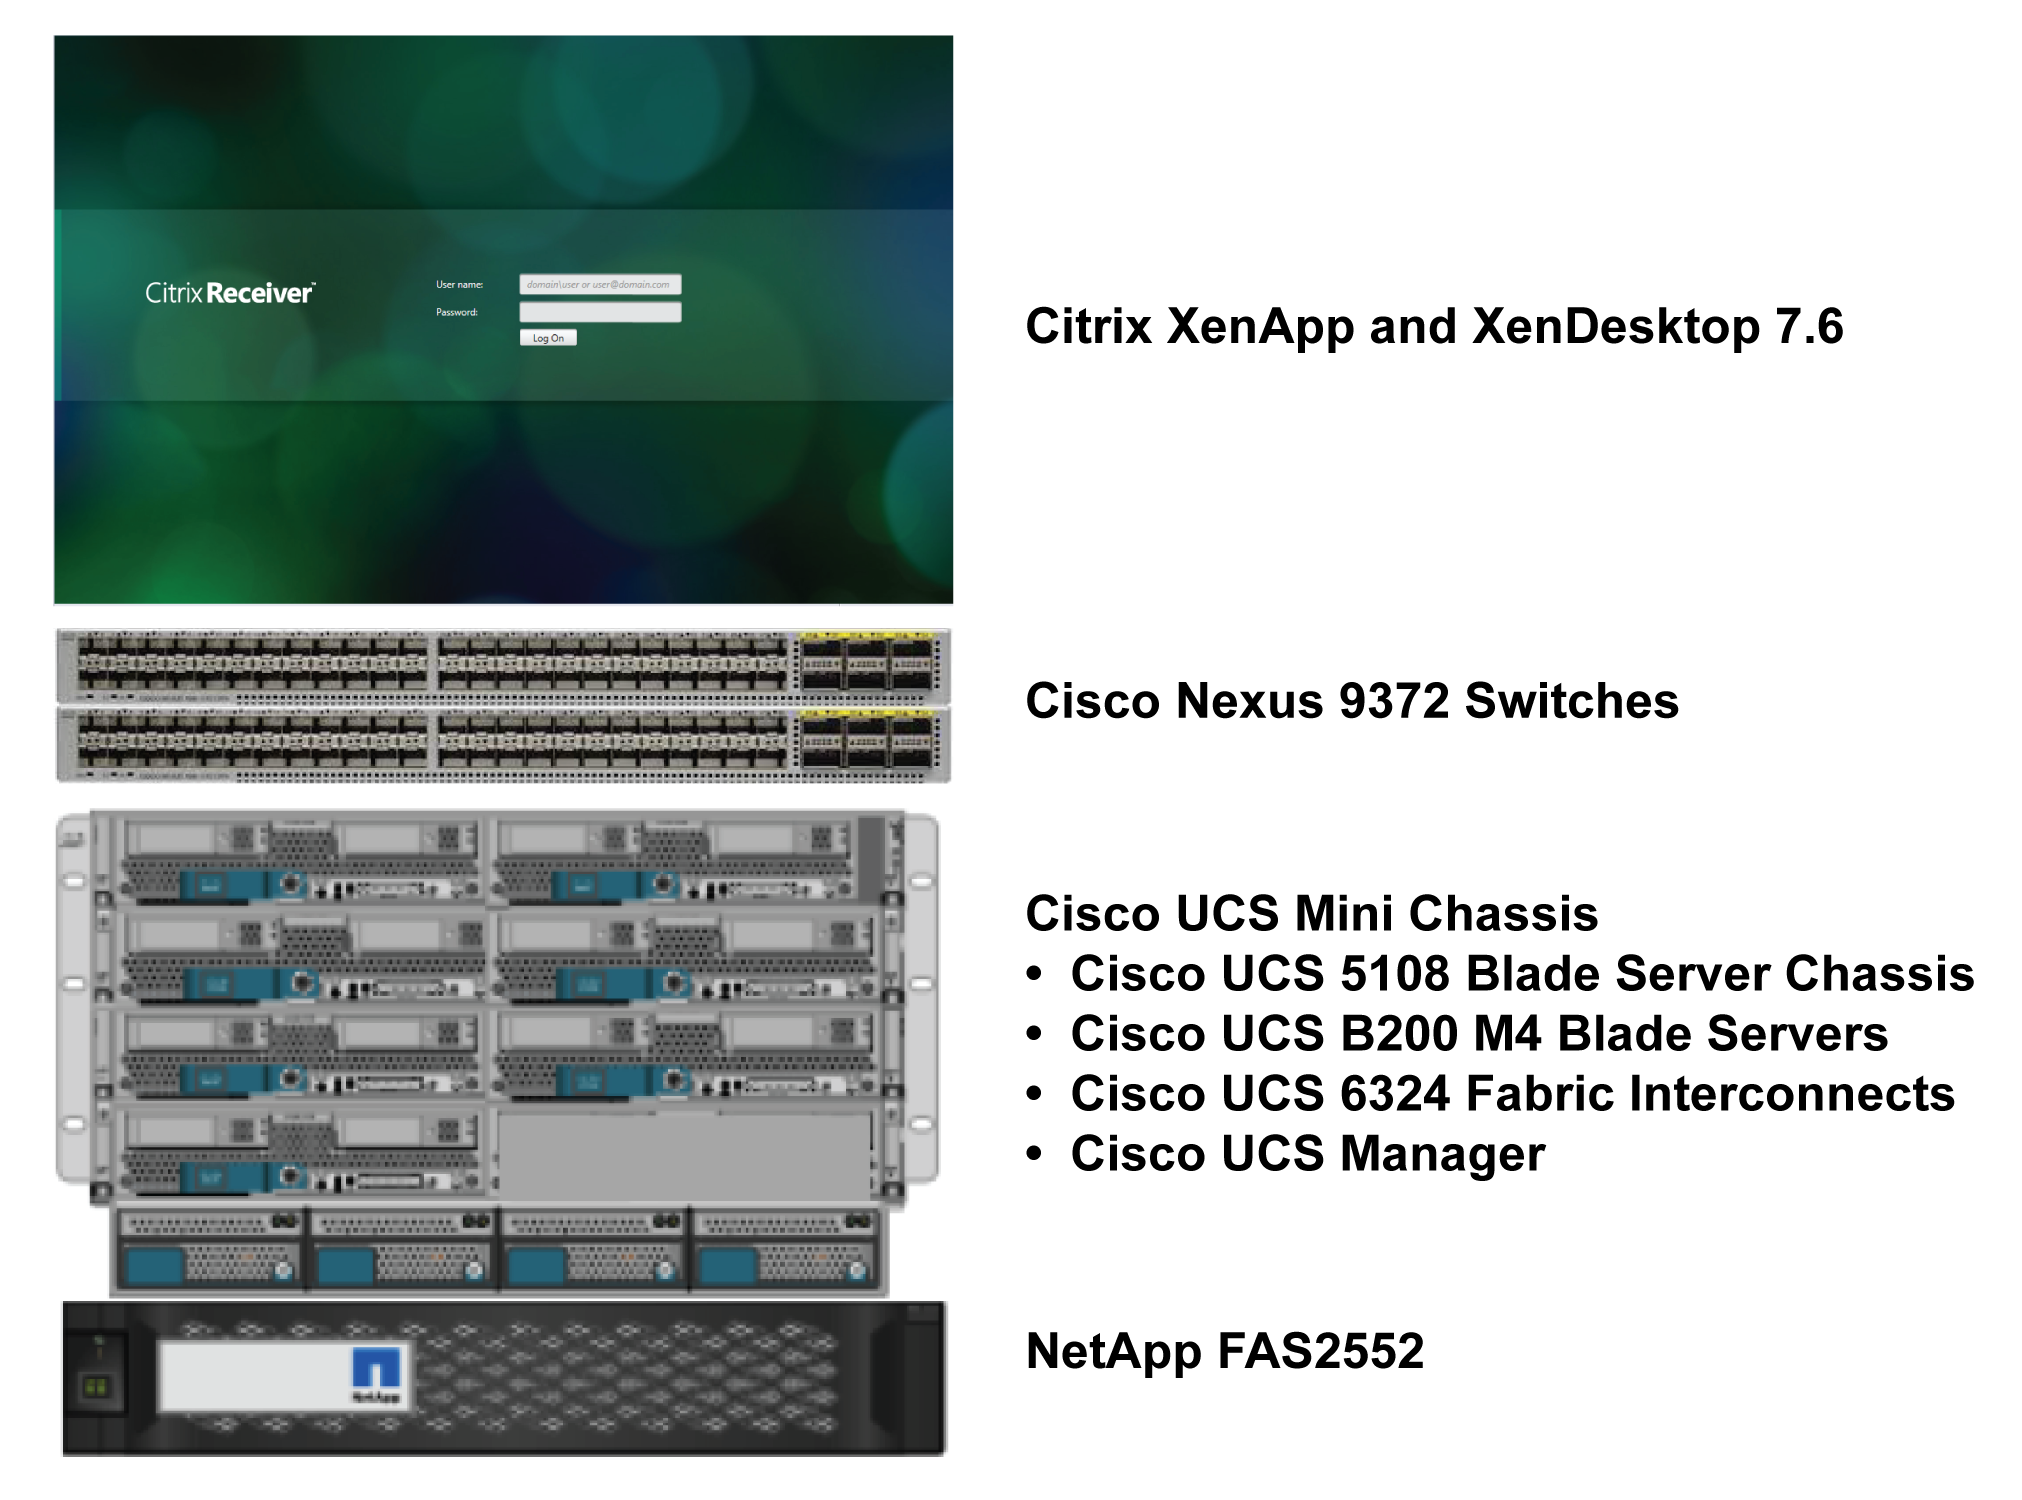
Figure 1: Reference architecture components in the FlexPod with Cisco UCS Mini solution
Solution Overview
Figure 1 shows the key components in the CVD reference architecture, including:
- Citrix XenApp and XenDesktop 7.6 software. Because Citrix XenDesktop 7.6 unifies the functionality of earlier XenApp and XenDesktop releases, the same software and same PVS Setup Wizard can provision both RDS sessions (on Windows Server 2012 R2) and pooled hosted VDI desktops (running Microsoft Windows 7 or Windows 8). In the CVD all infrastructure and RDS/VDI workload servers were 100% virtualized on VMware vSphere ESXi 5.5 Update 2.
- Cisco UCS Mini. The Cisco UCS Mini combines servers, storage, and a 10 Gigabit networking fabric in an easy-to-deploy, compact form factor. The chassis can support up to eight half-width Cisco UCS B200 M4 Blade Servers, each featuring dual 10-core 2.6 GHz Intel Xeon (E5-2660v3) processors and 256GB. In this CVD, between four and seven blade servers were configured for the various test cases. Two Cisco UCS 6324 Fabric Interconnects provide redundant, high bandwidth LAN and storage connectivity for the blade servers and the chassis, and can optionally connect to rack servers as well. Cisco UCS Manager manages all Cisco UCS Mini software and hardware components, and Cisco UCS Central can aggregate multiple UCS Manager domains for comprehensive policy control and centralized management.
- Cisco Nexus 9372 Switches. To support 10 GbE connectivity for the FlexPod solution, these Layer 2/Layer3 access switches each feature 48 1/10-Gbps Small Form Pluggable Plus (SFP+) ports and 6 Quad SFP+ (QSFP+) uplink ports. In addition, the Nexus 9373 is Cisco ACI capable.
- NetApp FAS2552 hybrid storage. The NetApp FAS2552 is a dual controller storage system that combines low-latency SSDs for caching and cost-effective SAS drives for capacity. The array configuration used in the testing included four 200GB SSDs and twenty 900GB SAS drives. The array controllers feature 10GbE ports to support blade server boot over iSCSI and NFS/CIFS connectivity for file system access.
Key Solution Advantages
The CVD architecture offers significant benefits to enterprise-edge or small business deployments:
- Self-contained and compact solution. The FlexPod with UCS Mini architecture defines an entirely self-contained “all-in-one” solution with the infrastructure needed to support a mix of up to 700 Citrix XenApp and XenDesktop users. The solution consumes only 10 rack units—the blade server chassis requires 6RU, NetApp storage takes 2 RU, and the switches occupy 2 RU. The entire “in-a-box” design fits in less than a single data center rack, conserving valuable data center rack space and simplifying deployments, especially in small business or standalone branch office environments.
- Cost-effective and scalable desktop virtualization for the enterprise edge. Powerful Cisco UCS blade servers enable high user densities at a low cost per seat. By adding additional blade servers to the chassis, a basic 4-server configuration supporting 350 users scales easily to support another 350 additional XenApp and XenDesktop users. The NetApp storage array features a combination of low-latency flash devices and a tray of less expensive SAS drives, for economical I/O over an end-to-end Ethernet fabric.
- Fault-tolerant design. The architecture defines redundant infrastructure and workload VMs across multiple physical Cisco UCS blade servers, optimizing availability to keep users productive.
- Easy to deploy and manage. UCS Manager can monitor and manage Cisco UCS servers in the FlexPod solution along with other Cisco UCS blade and rack servers in the management domain. Cisco UCS Central can extend management across Cisco UCS Manager domains and centralize management across multiple remote sites.
- Fully validated and proven solution. The CVD defines a reference architecture that has been tested under aggressive usage scenarios, including boot and login storms. Test requirements mandated that each configuration boot within 15 minutes and complete logins in 48 minutes at the peak user densities tested.
Testing Methodology
To generate load in the environment, Login VSI 4.1.4 software from Login Consultants (www.loginvsi.com) was used to generate desktop connections, simulate application workloads, and track application responsiveness. In this testing, the default Login VSI 4.1 Office Worker workload was used to simulate office productivity tasks (Microsoft Office, Internet Explorer with Flash, printing, and PDF viewing) for a typical knowledge worker.
Login VSI records response times during workload operations. Increased latencies in response times indicated when the system configuration was saturated and had reached maximum user capacity. During the testing, comprehensive metrics were captured during the full virtual desktop lifecycle: desktop boot-up, user login and desktop acquisition (login/ramp-up), user workload execution (steady state), and user logoff. Performance monitoring scripts tracked resource consumption for infrastructure components.
Login VSI 4.1.4 features updated workloads that reflect more realistic user workload patterns. In addition, the analyzer functionality has changed—a new Login VSI index, VSImax v4.1, uses a new calculation algorithm and scale optimized for high densities, so that it is no longer necessary to launch more sessions than VSImax.
Each test run was started from a fresh state after restarting the blade servers. To begin the testing, we took all desktops out of maintenance mode, started the virtual machines, and waited for them to register. The Login VSI launchers initiated desktop sessions and began user logins (the login/ramp-up phase). Once all users were logged in, the steady state portion of the test began in which Login VSI executed the application workload.
Test metrics were gathered from the hypervisor, virtual desktop, storage, and load generation software to assess the overall success of an individual test cycle. Each test cycle was not considered passing unless all of the planned test users completed the ramp-up and steady state phases within the required timeframes and all metrics were within permissible thresholds. Three test runs were conducted for each test case to confirm that the results were relatively consistent.
We conducted five different test cases:
- Testing single server scalability under a maximum recommended RDS load. The maximum recommended single server user density occurred when CPU utilization reached a maximum of 90-95%.
- Testing single server scalability under a maximum recommended VDI load. Again, the maximum recommended density occurred when processor utilization reached a maximum of 90-95%.
- Testing multiple server scalability using a 4-blade server base configuration under a mixed 350-user workload.
- Extending the base configuration to 700 users with an RDS focus.
- Extending the base configuration to 700 users with a VDI focus.
Test configurations
Figure 2 shows the VM configurations for each of the five test cases. In addition to RDS and VDI workload VMs, infrastructure servers were defined to host XenDesktop Delivery Controllers, Studio, StoreFront, Licensing, Director, Citrix Provisioning Services (PVS), SQL, Active Directory, DNS, DHCP, vCenter, and NetApp Virtual Storage Console.
Figure 2: VM configurations for the five test cases.
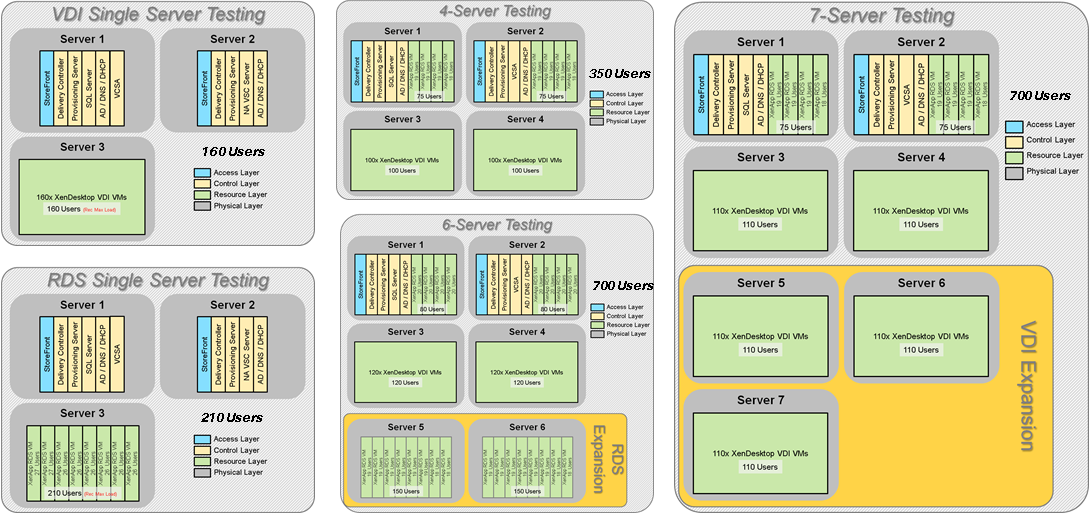
For the multiple server scalability tests, multiple workload and infrastructure VMs were hosted across more than one physical blade. Configuring N+1 servers as shown enables a highly available yet cost-effective configuration for smaller deployment sites.
Table 1 shows the VM definitions used for the RDS and VDI workload servers. We first tested different virtual CPU (vCPU) configurations, finding that the best performance was achieved when not overcommitting CPU resources. Optimal performance was observed when each RDS VM was configured with five vCPUs and 24GB RAM, and each VDI VM was configured with 2 vCPUs and 1.5GB RAM.
Table 1: RDS and VDI VM configurations

This CVD used Citrix Provisioning Server 7.6. When planning a PVS deployment, design decisions need to be made regarding PVS vDisk and PVS write cache placement. In this CVD, the PVS write cache was located on RAM with overflow to disk (NFS storage volumes), reducing the number of IOPS to storage. PVS vDisks were hosted using CIFS/SMB3 via NetApp, allowing the same vDisk to be shared among multiple PVS servers while providing resilience in the event of storage node failover.
Main Findings
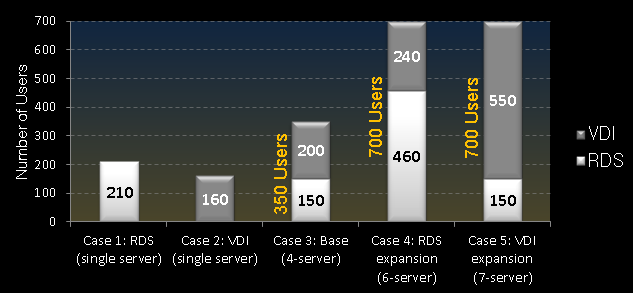
Figure 3 summarizes the five test cases and the maximum RDS and VDI user densities achieved in each. The first two test cases examined single server scalability for RDS and VDI respectively, determining the recommended maximum density for each workload type on a Cisco UCS B200 M4 blade with dual Intel® E5-2660 v3 processors and 256GB of RAM. The other three tests analyzed the performance of mixed workloads on multiple blade servers. Multiple blade testing showed that the configurations could support mixed workload densities under simulated stress conditions (cold-start boot and simulated login storms).
Figure 3: Five test cases were run to examine single server and multiple server scalability.
Test Case 1: Single Server Scalability, RDS
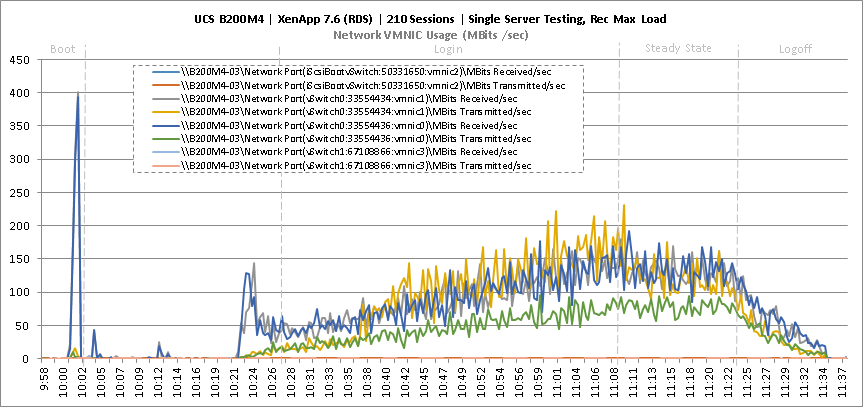
We started by testing single server scalability for XenApp hosted shared desktop sessions (RDS) running the Login VSI 4.1 Office Worker workload. A dedicated blade server ran eight VMs hosting Windows Server 2012 sessions. This test determined that the recommended maximum density was 210 RDS sessions. The graphs below show the 210-user VSIMax v4.1 results along with resource utilization metrics for the single server RDS Office Worker workload. Note that all metrics, especially CPU utilization during steady state, did not exceed requirements at this capacity. The full CVD contains additional performance metrics, including performance metrics for various infrastructure VMs.
Figure 4: Single Server Scalability, XenApp 7.6 RDS, VSIMax v4.1 Density
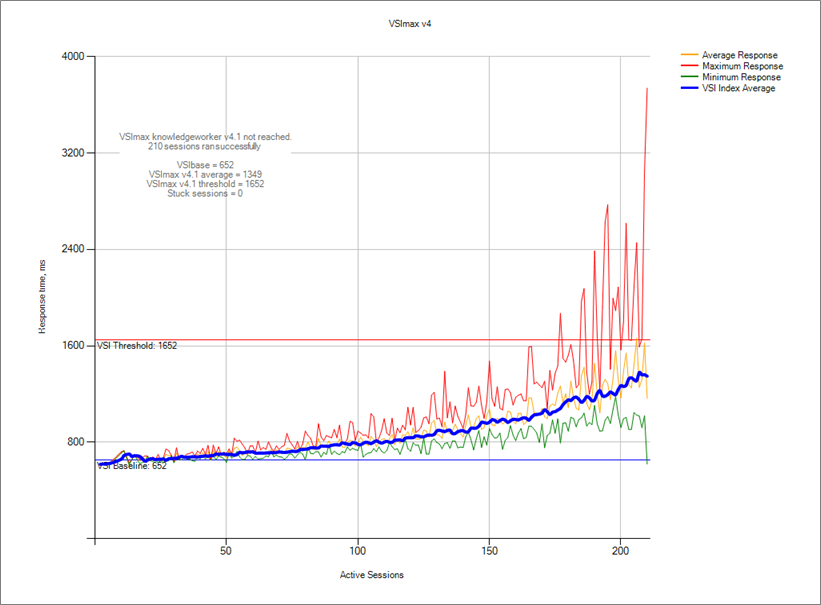
Figure 5: Single Server Scalability, XenApp 7.6 RDS, CPU Utilization
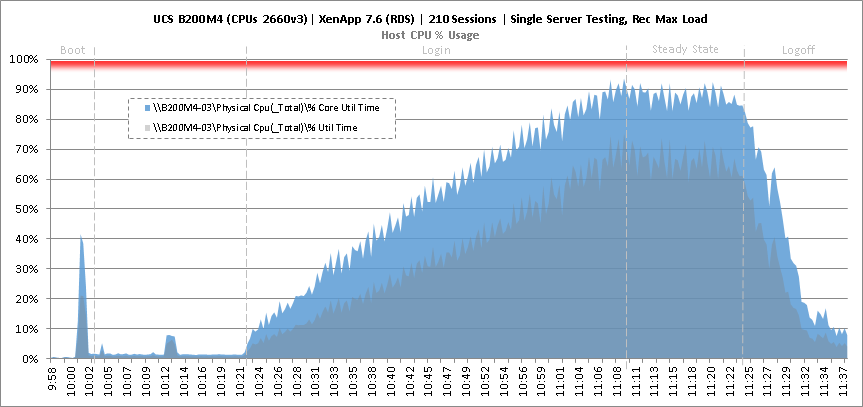
Figure 6: Single Server Scalability, XenApp 7.6 RDS, Memory Utilization
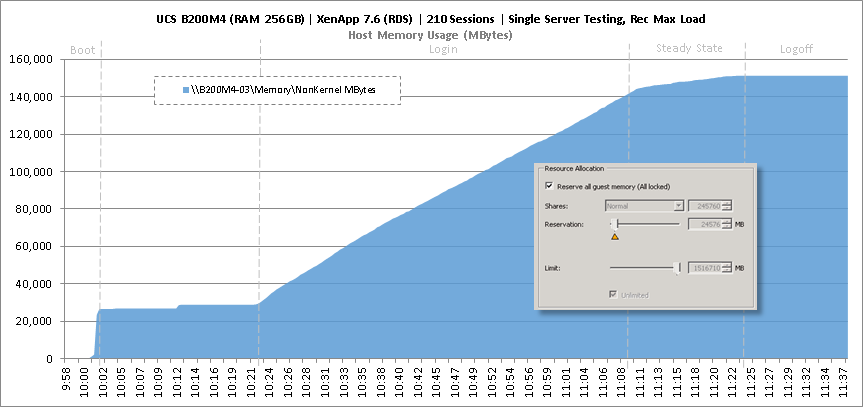
Figure7: Single Server Scalability, XenApp 7.6 RDS, Network Utilization
Test Case 2: Single Server Scalability, VDI
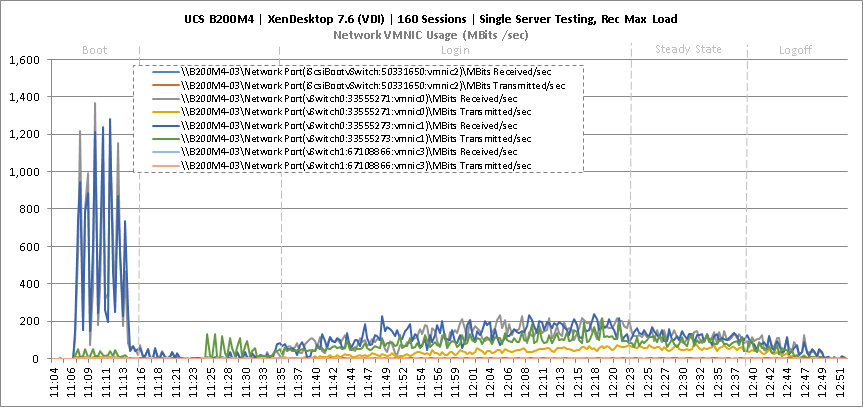
In the second test case, we tested single server scalability for XenDesktop hosted virtual desktops (VDI) running the Login VSI 4.1 Office Worker workload. The recommended maximum density for a single blade server was 160 desktops hosting Microsoft Windows 7 (32-bit). The graphs below show the 160-seat VSIMax v4.1 results for single server VDI along with resource utilization metrics. Again these metrics, especially CPU utilization during steady state, were well within permissible bounds.
Figure 8: Single Server Scalability, XenApp 7.6 VDI, VSIMax v4.1 Density

Figure 9: Single Server Scalability, XenApp 7.6 VDI, CPU Utilization

Figure 10: Single Server Scalability, XenDesktop 7.6 VDI, Memory Utilization
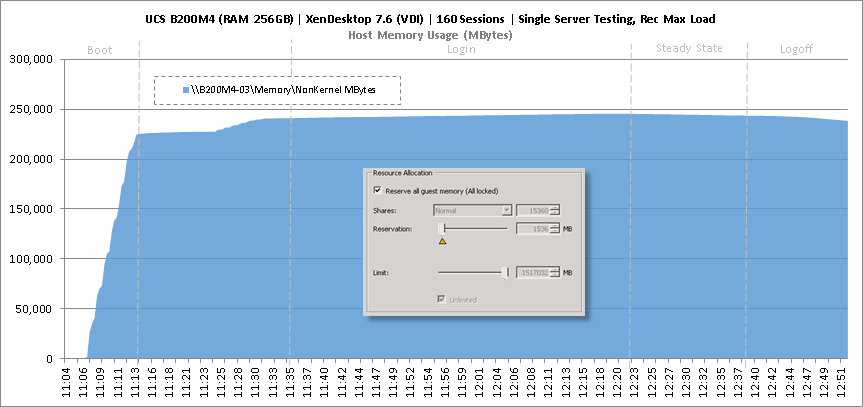
Figure11: Single Server Scalability, XenDesktop 7.6 VDI, Network Utilization
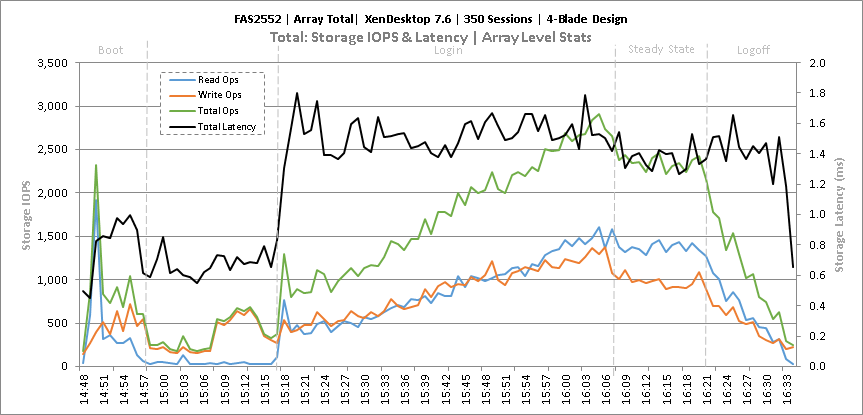
Test Case 3: 4-Blade, Mixed Workload, 350 Users
In this full-scale test case, 4 blade servers were used to support a mixed RDS/VDI workload in which N+1 infrastructure and workload servers were configured for fault tolerance. The 4-server configuration supported 150 RDS sessions on Windows Server 2012 and 200 Windows 7 VDI users. The graphs below show the VSIMax v4.1 results for the 4-server mixed workload and total storage IOPS and latencies.
Figure12: 4-Server Scalability, 350 Mixed Users, VSIMax v4.1 Density
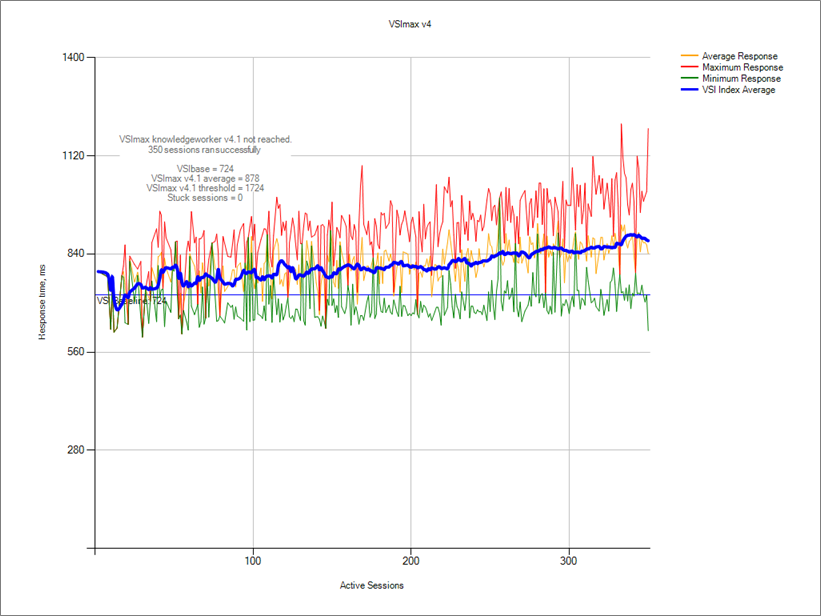
Figure13: 4-Server Scalability, 350 Mixed Users, Total IOPS and Latency
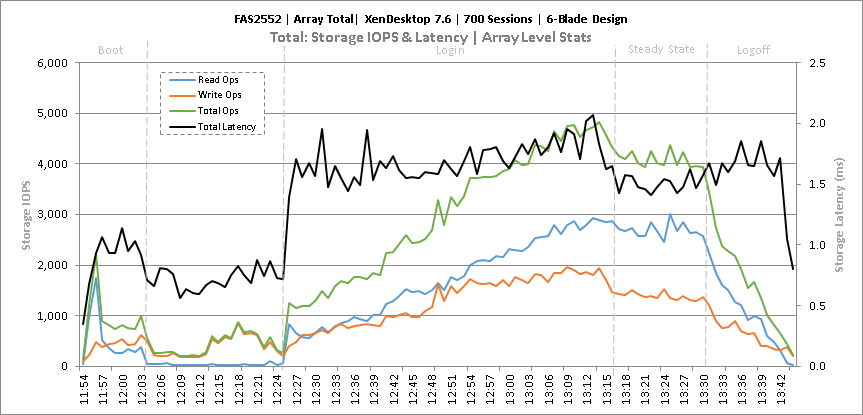
Test Case 4: 6-Blade, Mixed Workload - RDS Expansion, 700 Users
To validate an environment that requires a larger number of RDS seats, six Cisco UCS B200 M4 blade servers were used to support a 700-seat workload: 460 RDS sessions and 240 VDI users. Again, N+1 infrastructure and workload servers were configured for fault tolerance. The graphs below show the VSIMax v4.1 results for the 6-server mixed workload and the total storage IOPS and latencies.
Figure 14: 6-Server Scalability, 700 Mixed Users, VSIMax v4.1 Density
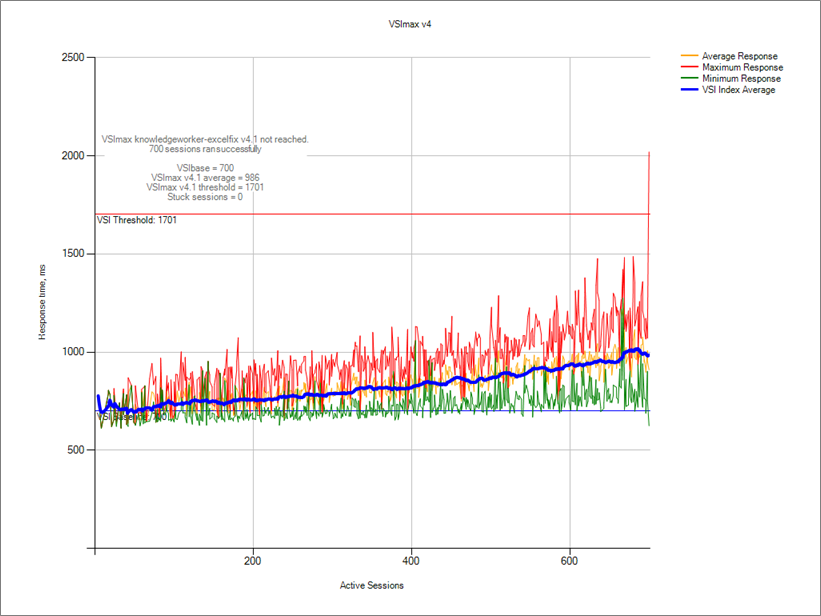
Figure 15: 6-Server Scalability, 700 Mixed Users, Total IOPS and Latency
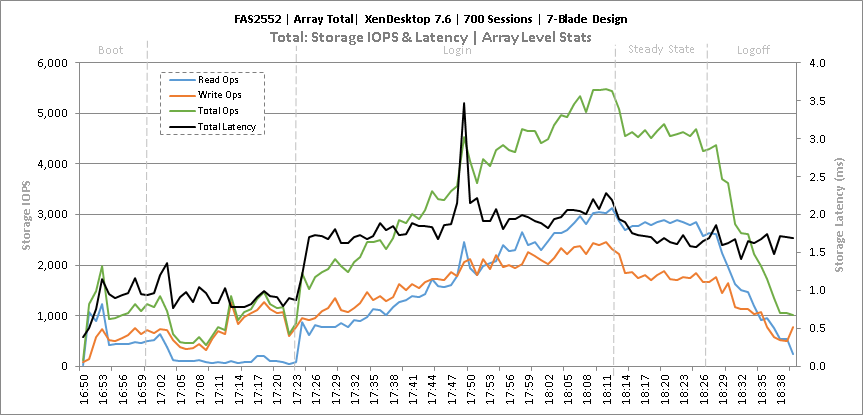
Test Case 5: 7-Blade, Mixed Workload - VDI Expansion, 700 Users
By expanding the base configuration to seven blade servers, the final test validated a mixed 700-seat deployment that was predominately VDI. In this test case, the N+1 configuration supported 150 RDS sessions and 550 VDI users. The graphs below show the VSIMax v4.1 results for the VDI expansion workload and the total storage IOPS and latencies during the test window.
Figure 16: 7-Server Scalability, 700 Mixed Users, VSIMax v4.1 Density
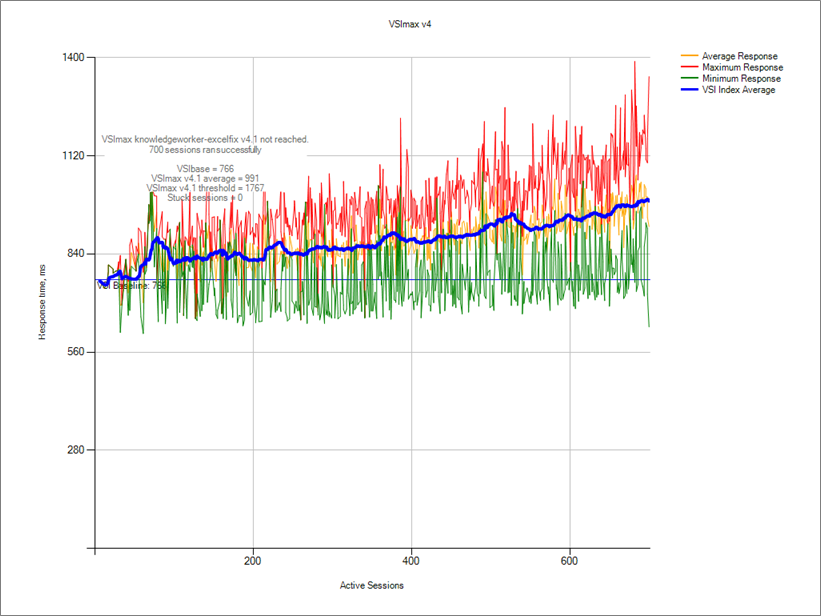
Figure 17: 7-Server Scalability, 700 Mixed Users, Total IOPS and Latency
Scalable Desktop Virtualization at the Enterprise Edge
The test results show how easily FlexPod with UCS Mini configurations can expand and flex, allowing deployments at the enterprise edge to grow and support greater RDS and VDI workloads. The Cisco UCS B200 M4 blade servers offer high performance to support high RDS/VDI densities, while the NetApp hybrid storage array and 10GbE connectivity optimizes IOPS and storage-related costs.
In the multiple blade test cases, the NetApp storage easily handled IOPS requirements for the 350 and 700-user workloads with average read and write latencies less than 5ms. Flash drives in the hybrid storage configuration helped to decrease latencies during the boot and login phases. During steady state, the storage experienced low IOPS, especially since the PVS write cache was configured to use RAM with overflow to storage, which decreased IOPS demands.
To see the full set of test results and learn more, you can access the full CVD here.
— Frank Anderson, Senior Solutions Architect, Cisco Systems, Inc. (@FrankCAnderson)
— Rob Briggs, Principal Solutions Architect, Citrix Systems, Inc. (@briggs_rob)
Labels:
1 Comment
You must be a registered user to add a comment. If you've already registered, sign in. Otherwise, register and sign in.
Getting Started
Find answers to your questions by entering keywords or phrases in the Search bar above. New here? Use these resources to familiarize yourself with the community:

Customers Also Viewed These Support Documents