- Cisco Community
- Technology and Support
- Networking
- Networking Knowledge Base
- Group-Based Policy Analytics Deployment Guide
- Subscribe to RSS Feed
- Mark as New
- Mark as Read
- Bookmark
- Subscribe
- Printer Friendly Page
- Report Inappropriate Content
- Subscribe to RSS Feed
- Mark as New
- Mark as Read
- Bookmark
- Subscribe
- Printer Friendly Page
- Report Inappropriate Content
09-01-2020 07:38 AM - edited 01-05-2022 08:49 AM
 |
For an offline or printed copy of this document, simply choose ⋮ Options > Printer Friendly Page. You may then Print, Print to PDF or copy and paste to any other document format you like. |
Jonothan Eaves
- Introduction
- About Group-Based Policy Analytics
- About This Guide
- Define
- Design
- Hardware and Software Requirements
- Network Device Compatibility Information
- Accessing the Graphical User Interface
- Deploy
- Zero Day Workflow
- Wired NetFlow Configuration
- Wireless NetFlow Configuration
- Operate
- Scalable Groups
- ISE Profile Groups
- Stealthwatch Host Groups
- Search Function
- Deployment Guide Summary
- Appendix
- List of Acronyms
NOTE: This function was in early trials with Cisco DNA Center version 2.1.1
General availability was with Cisco DNA Center version 2.1.2
Introduction
About Group-Based Policy Analytics
Group-Based Policy Analytics is an application on Cisco DNA Center which helps administrators visualize group to group interactions, and helps to build policies by using discovered ports and protocols used between groups.
The 'Define' section below covers the challenges customers face today and the solution provided by Group-Based Policy Analytics. Also covered are the delivery phases and components of the solution.
About This Guide
This guide is intended to provide technical guidance for deploying Group-Based Policy Analytics. The guide covers design topics, deployment best practices and how to get the most out of the technology operation.
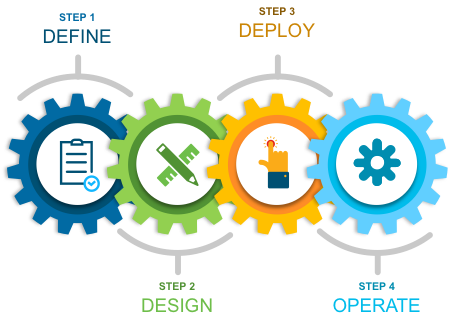
As highlighted in figure 1 above, there are four major sections in this document. The initial, define section presents a high-level overview of the challenges customers face today and the solution that Group-Based Policy Analytics provides. Next, in the design section, we will see how to design the environment ready for deploying Group-Based Policy Analytics. Third, in the deploy part, the various configuration and best practice guidance will be provided for key components such as Cisco Identity Services Engine (ISE), Cisco DNA Center, Switches and Wireless LAN Controllers. Lastly, in the operate section, we will learn how best to operate the application within Cisco DNA Center.
Define
As a solution to this challenge, Cisco is providing an Application on Cisco DNA Center which currently provides:

Design
Group-Based Policy Analytics is an Application on Cisco DNA Center but has been designed to discover group to group interactions whether the groups are assigned inside or outside an SD-Access fabric.
Hardware and Software Requirements
The following information covers the hardware and software requirements for Group-Based Policy Analytics:
Starting with DNA Center version 2.1.2, ISE versions recommended: 2.4 P13 / 2.6 P7 / 2.7 P2 (or later)
Cisco DNA Advantage License
Stealthwatch version 7.x (or later)
ISE sends the security groups and ISE Profiles, along with the associated network access device, to Cisco DNA Center over pxGrid. Cisco DNA Center will only accept this information if those network access devices have been discovered and are visible within the Inventory (point number 3 above). This session filtering mechanism has been incorporated to cater for multiple Cisco DNA Center platforms connecting to a single ISE.
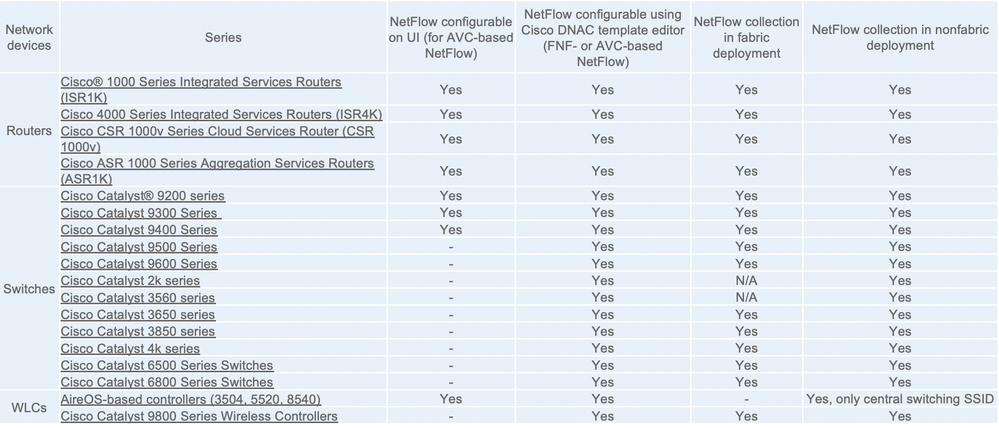
Network Device Compatibility Information
Accessing the Graphical User Interface

and then select Policy > Group-Based Access Control
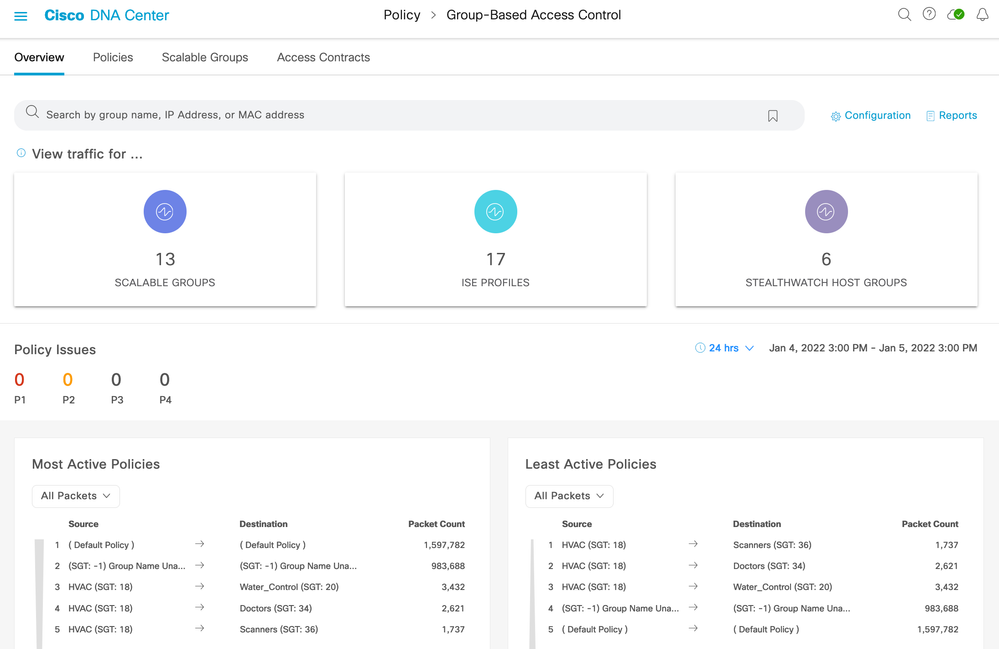
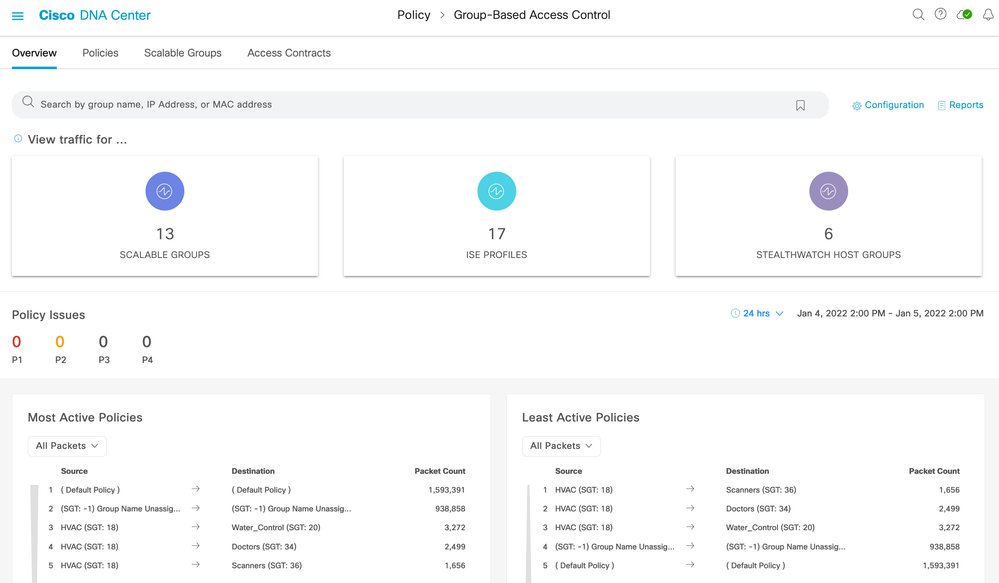
Group-Based Policy Analytics used to reside in an Analytics menu under the Group-Based Access Control screen, now the functions are accessible within the Overview tab:
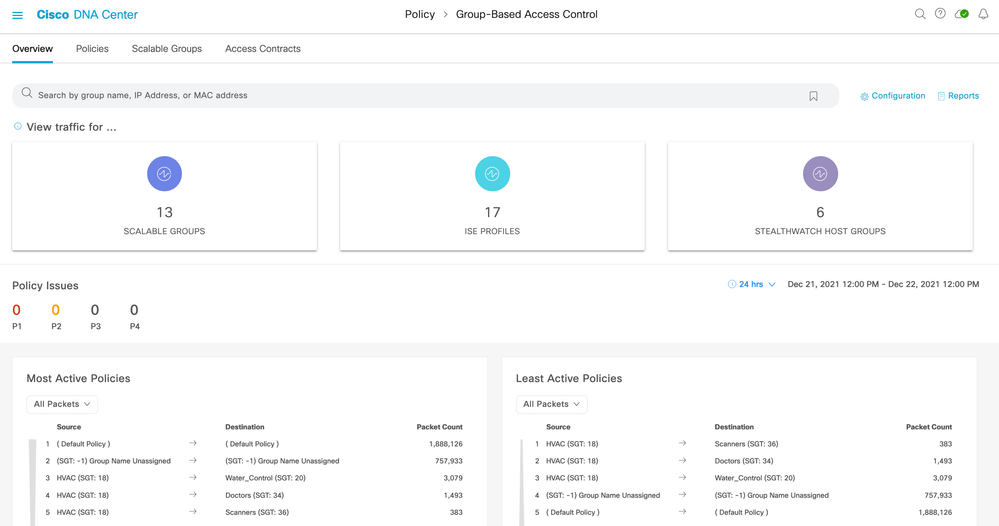
The top half of the screen shows group entities learned from ISE (scalable groups and ISE profiles) and from Stealthwatch (host groups). Stealthwatch connectivity is optional.
In the middle you see Policy Issues which are issues that Cisco DNA Center has detected within the selected date and time period. These are the same as shown within Assurance but filtered specifically to show only the issue counts related to policy.
The bottom of the screen shows hit counts for deployed policies. Role-based policy counters are retrieved from network devices using TDL streaming and displayed for most active and least active policies.
If ISE is not yet connected when navigating to Group-Based Access Control, then a wizard will be displayed helping the administrator to connect ISE, Steathwatch (optional) and provide help for setting up NetFlow.
Deploy
Zero Day Workflow
When Cisco DNA Center release 2.1.1 or later is installed then Group-Based Policy Analytics is available with Cisco DNA Advantage license.
As mentioned previously, if ISE has not previously been connected then the navigation to Policy > Group-Based Access Control will instigate a Zero Day workflow.
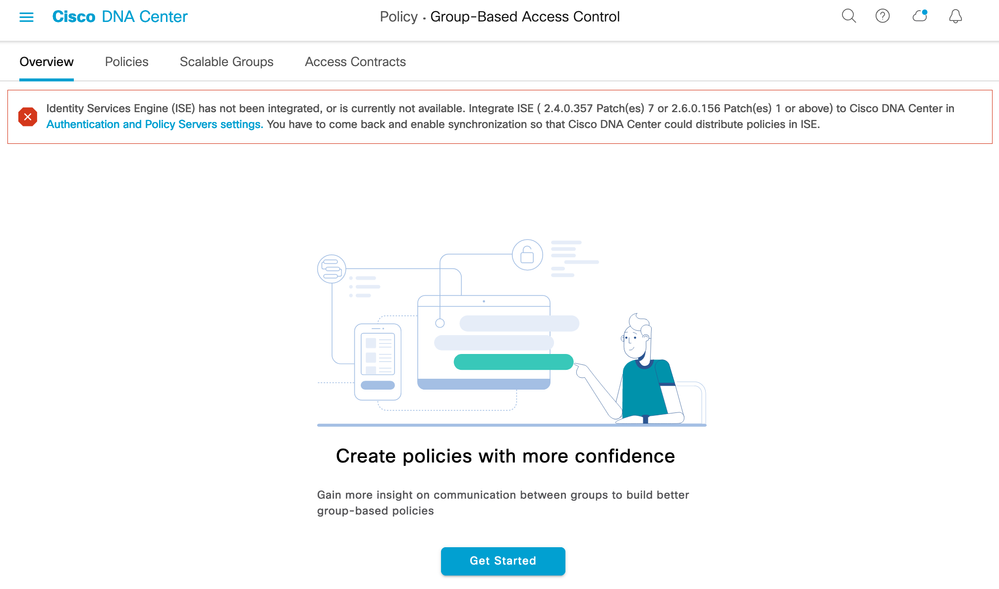
Click 'Get Started'.
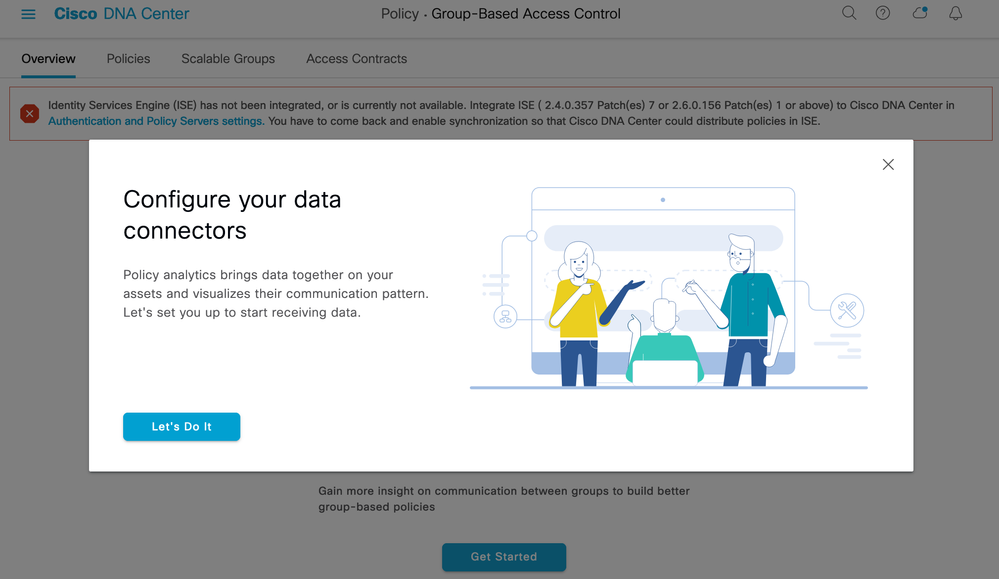
Click 'Let's Do It'. The Data Connectors can then be configured for ISE and optionally Stealthwatch:

Click on the 'Configure' link for ISE, a new browser tab will open to allow a new authentication and policy server to be added with your ISE details as follows:
Server IP Address: The IP Address of the ISE Primary PAN node.
Shared Secret: The ISE shared secret used between ISE and network devices
Username: ISE username
Password: ISE password (GUI and CLI password must be the same)
FQDN: ISE Primary PAN URL

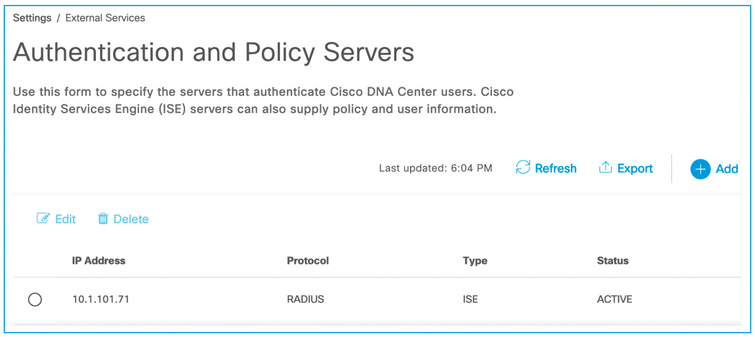
The configuration status will take a few minutes to activate and you may have to accept the pxGrid approval request in ISE depending on the settings. When complete, the ISE connection status shown is ACTIVE:
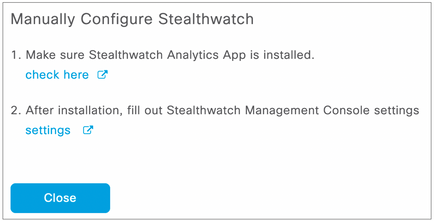
Note: The Stealthwatch Analytics App (option 1 above) is just required to be installed to be able to retrieve the Host Groups. It does not need to be set up because network devices do not need to send NetFlow data to Stealthwatch. While that may be a particular requirement for the deployment, it is not a requirement purely for Group-Based Policy Analytics. Click “check here” to see if the Stealthwatch Analytics App is installed.
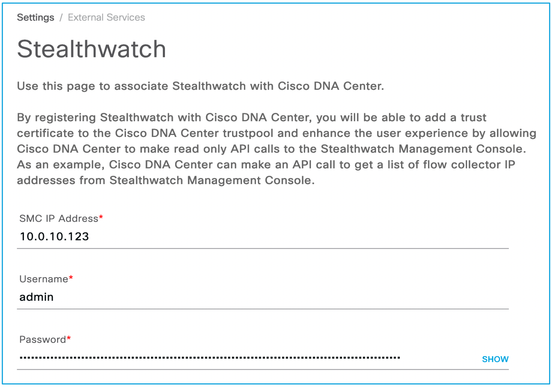
Click “settings” for option 2 above (that is, to set up connectivity to the Stealthwatch Management Console) and complete the connectivity information. This is used to retrieve Host Groups from Stealthwatch should they want to be used in the Policy Analytics application:
Once the Group Data Connectors are set up, the workflow continues with the Communication Connectors (for setting up NetFlow):

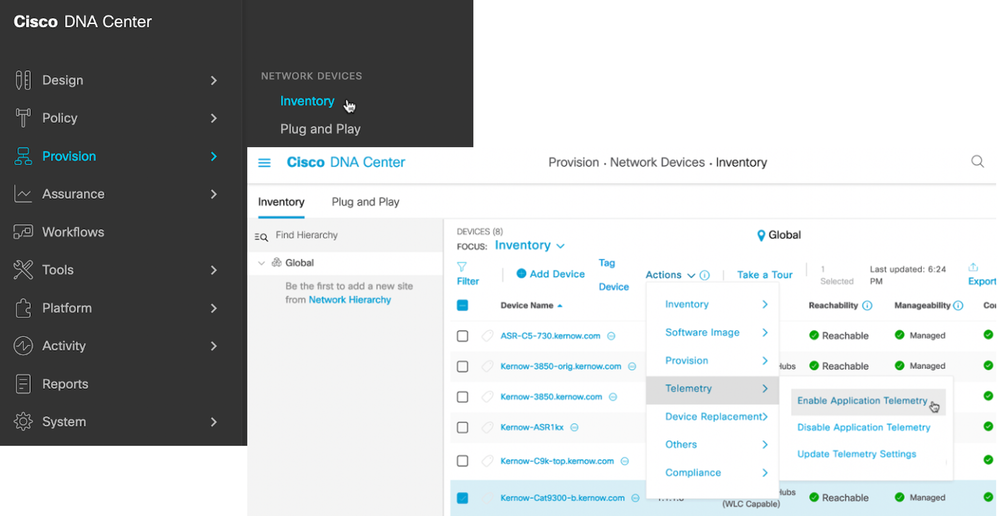
As can be seen from the options, the Template Editor can be used to send NetFlow configuration to the network devices. However, the use of the Telemetry function makes this configuration much easier (but note the device types supported in the GUI text displayed above and the prerequisite 'lan' keyword requirement).
[Note: release 2.1.2 supports a new methodology of enabling NetFlow on device interfaces as well as continuing to support 'lan' in the description. See this link for the criteria comparison of the two methods].
Clicking on 'Telemetry in Network Settings' navigates to the Telemetry section in the Design menu. Scroll down and enable 'Use Cisco DNA Center as NetFlow Collector server' as shown below and save the change:

Wired NetFlow Configuration
The wired NetFlow configuration that is pushed to network devices is shown below. This will help in Template creation if required. The 'description lan' on the interface is not pushed and adding this manually is one method that Cisco DNA Center detects on which interfaces to enable the function:
|
flow record dnacrecord |
flow exporter dnacexporter |
|
flow monitor dnacmonitor |
interface GigabitEthernet1/0/1 |
Wireless NetFlow Configuration
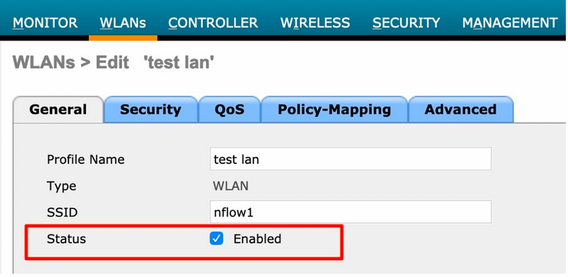
The wireless NetFlow configuration that is pushed to network devices is shown below. This will help in Template creation if required. The term 'lan' in the Profile Name is not pushed and adding this manually is one method that Cisco DNA Center detects on which profiles to enable the function:
Creating Exporter and Monitor
config flow create exporter dnacexporter <exporterIp> port <exporterPort>
config flow create monitor dnacmonitor
config flow add monitor dnacmonitor exporter dnacexporter
config flow add monitor dnacmonitor record ipv4_client_src_dst_flow_record
Applying monitor to WLAN
config wlan disable <wlan_id>
config wlan flow <wlan_id> monitor dnacmonitor enable
config wlan enable <wlan_id>
Once ISE and NetFlow is setup (and optionally Stealthwatch) and data is being received, navigating to Policy > Group-Based Access Control will show counts in the group boxes within the Overview tab:
If the ISE/Stealthwatch/NetFlow setup screens need to be accessed again once deployed, use the Configuration link near the top right of the page shown above. Once clicked, select the Analytics Settings menu:

Operate
The top of the main page (navigation is Policy > Group-Based Access Control [defaults to the Overview tab]) consists of a search bar and counts within tiles. If connectivity to Stealthwatch has been made then three tiles will be shown, otherwise just two will be present:

Scalable Groups
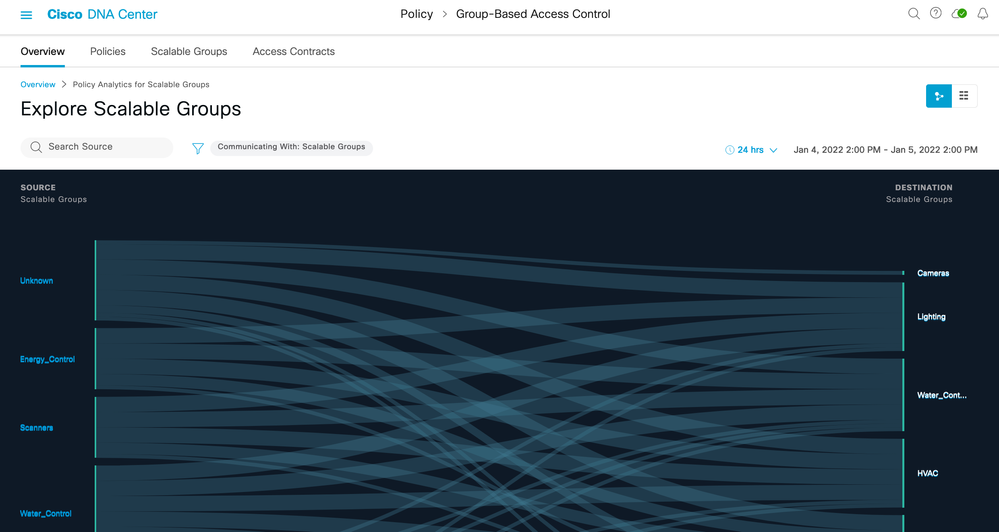
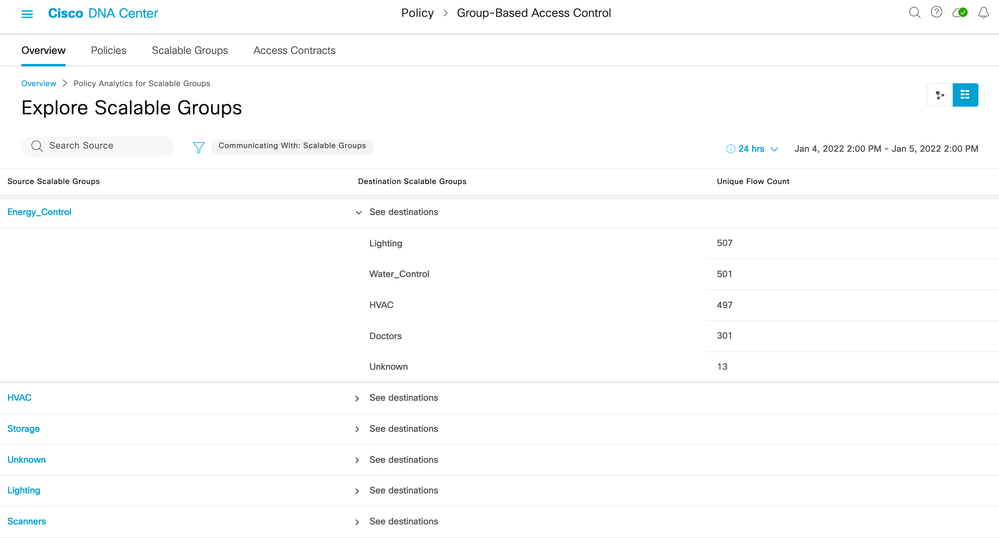
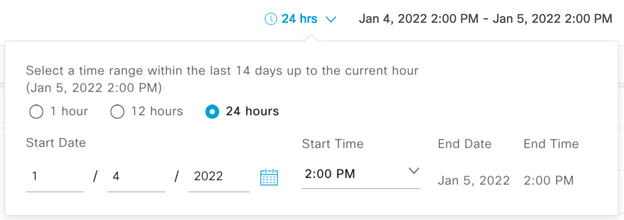
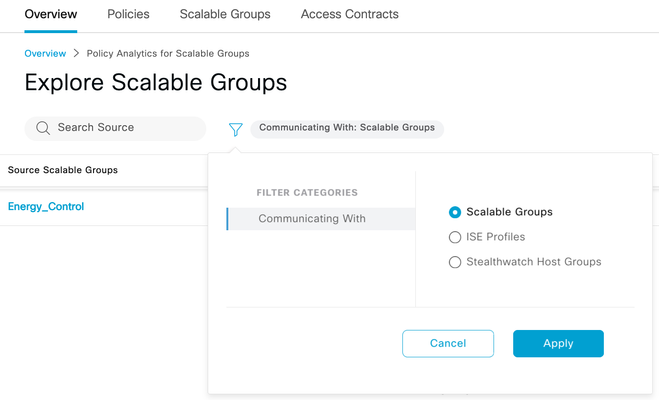
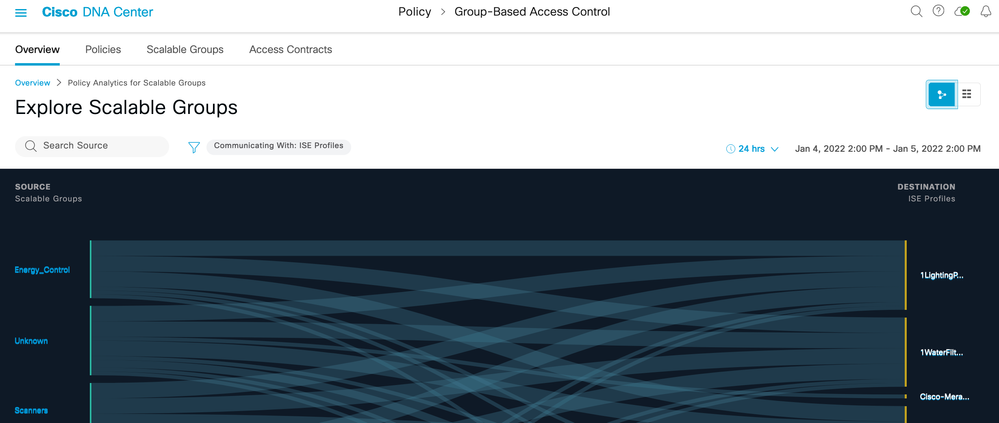

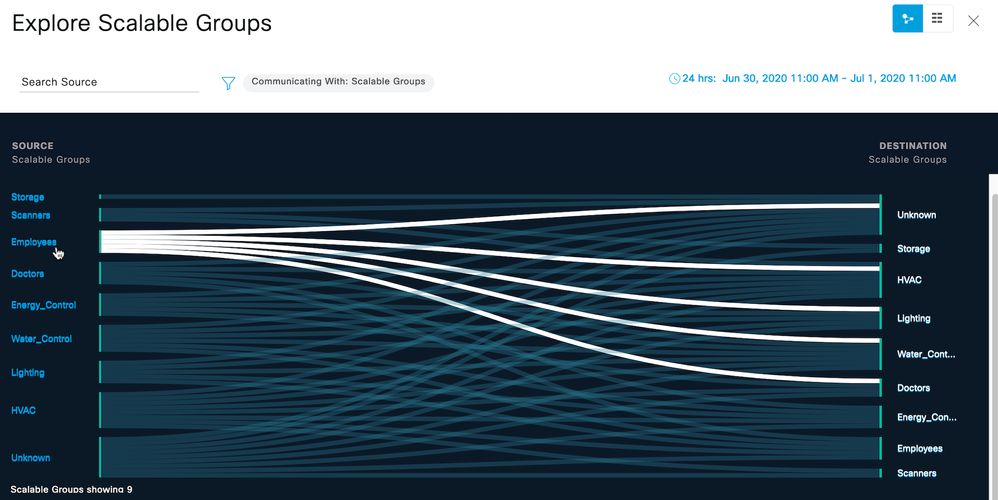
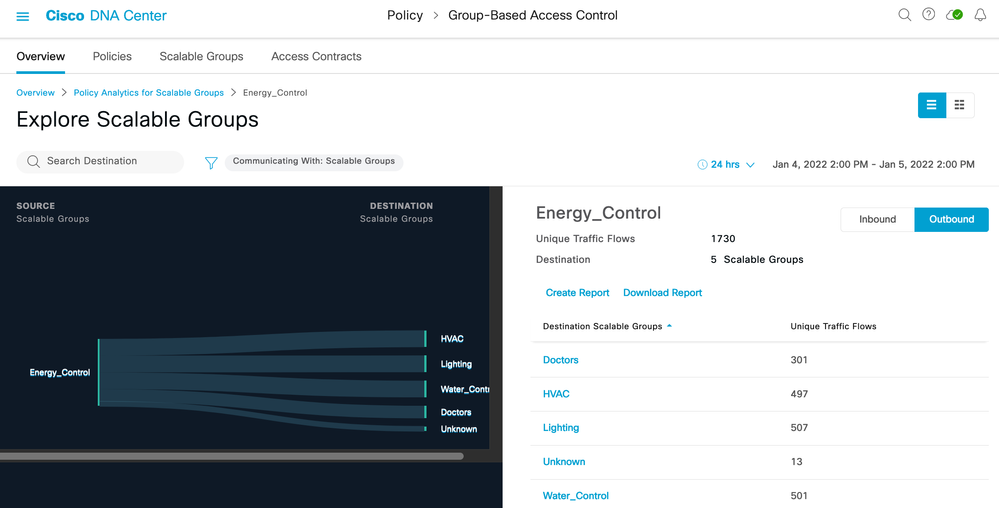
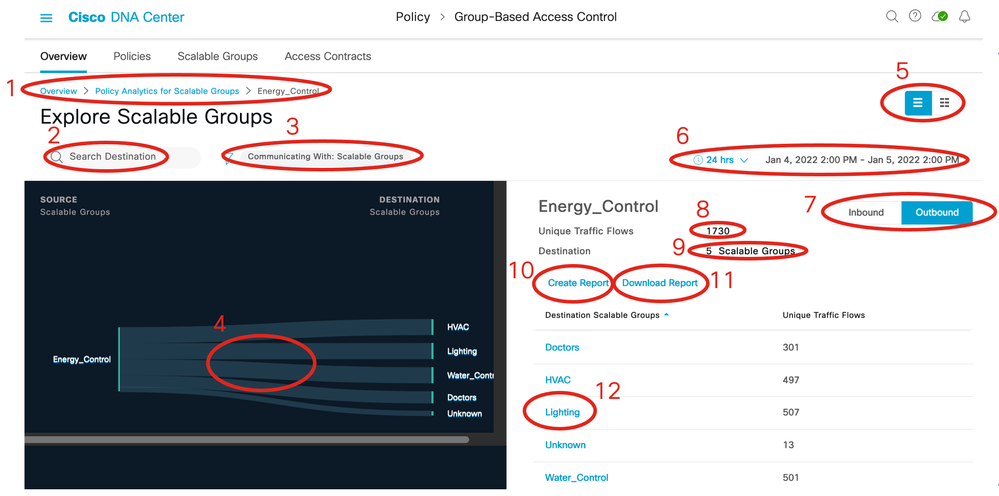
1) Breadcrumbs (Click each item to change the display.)
2) Search for Scalable Groups.
3) Click the blue filter icon to change the destination group type (Communicating With)
4) Click individual flow to show details of that flow.
5) Toggle between chart view and table view.
6) Set date and time range for data display.
9) Number of destination groups
10) Create a report (Found at Report > Generated Reports).
11) Download a previously created report.
12) Click destination group to navigate to the detail 1-1 page.
The blue icon under “Last Run” shows the data is being collated, below is an example:

When the data collection has completed, the icon turns green, and a download icon is displayed:

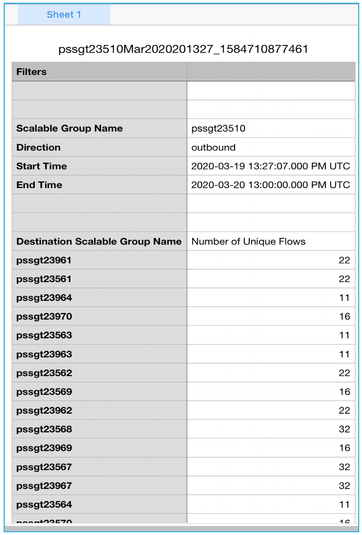

When selected, a chart showing a 1-1 group interaction is displayed along with applications, ports and protocols discovered between those groups. It is this information which will allow access control policies to be built with confidence:
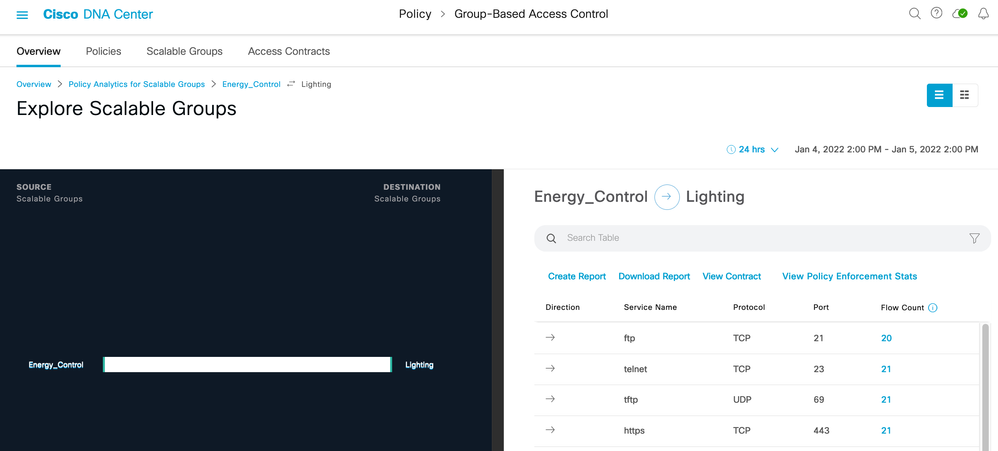
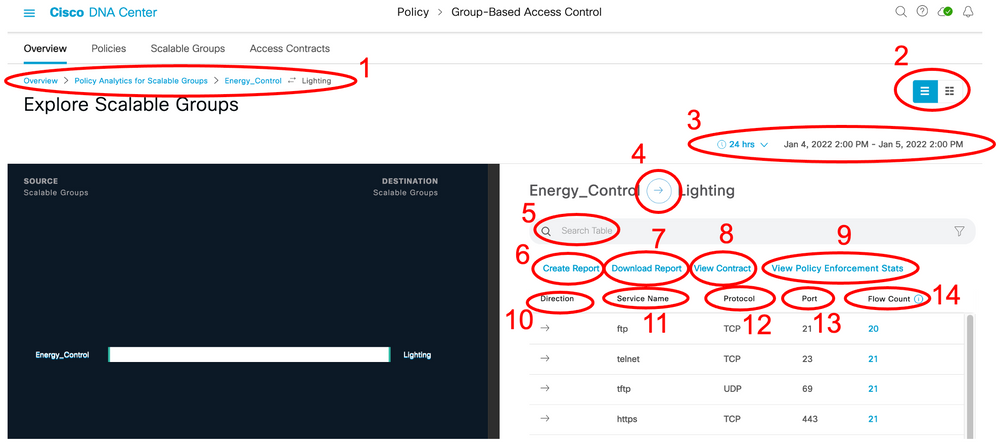
1) Breadcrumbs (Click each item to navigate back to previous screens).
2) Toggle between chart view and table view.
3) Set the date and time range for the data display.
4) Change the data displayed depending on the direction of flow.
5) Search bar.
6) Create a report of the displayed data.
7) Download a report.
9) View graph of policy enforcement stats (requires Frey release 2.3.2 and Netconf to retrieve policy counters from network devices).
11) Shows the Application/Service name
13) Shows the port number
14) Shows the flow count within that row and clicking the entity navigates to the endpoint details (requires Frey release 2.3.2)
If 'View Contract' is selected (number 8 above), then not only will the discovered ports and protocols be displayed between those two groups, but the configured contract between the groups will also be shown for an easy comparison of discovered traffic vs configured policy/contract:
If 'Flow Count' is selected (number 14 above), then the associated endpoint details are displayed:
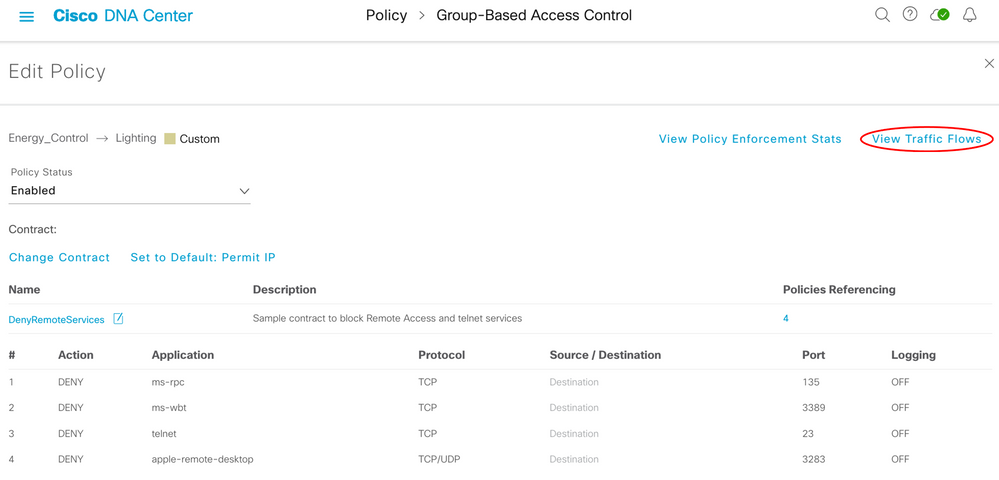
Traffic flow details can also be accessed via the Group-Based Access Control screen and Policies menu. When navigating using Group-Based Access Control/Policies, click on a cell to view the assigned contract, a 'View Traffic Flows' option is shown:
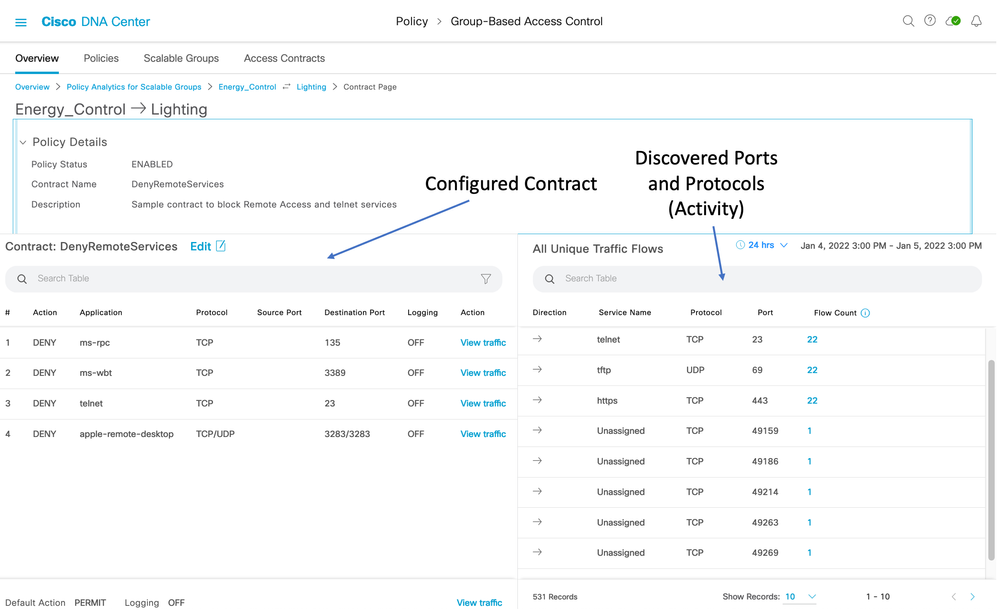
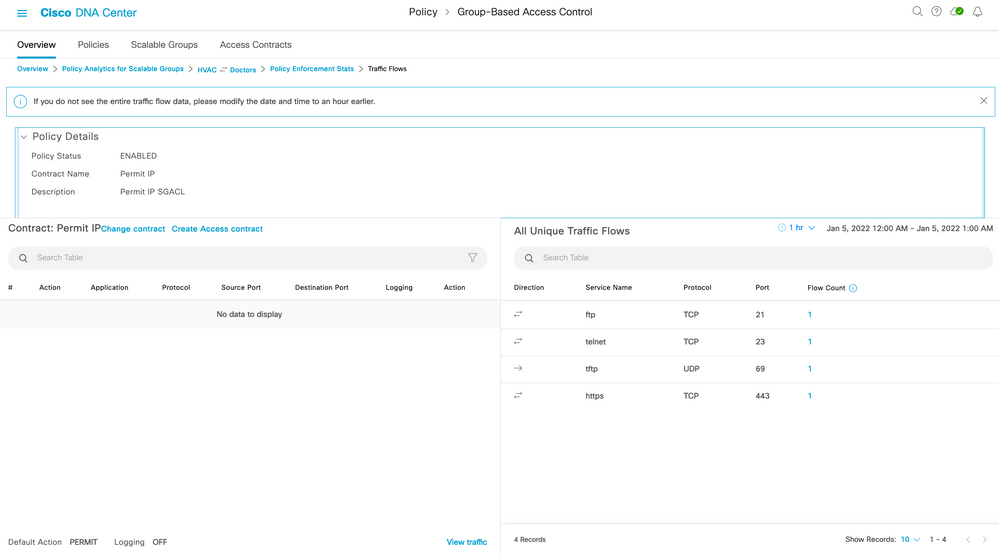
When selected, the discovered activity is shown beside the configured contract:
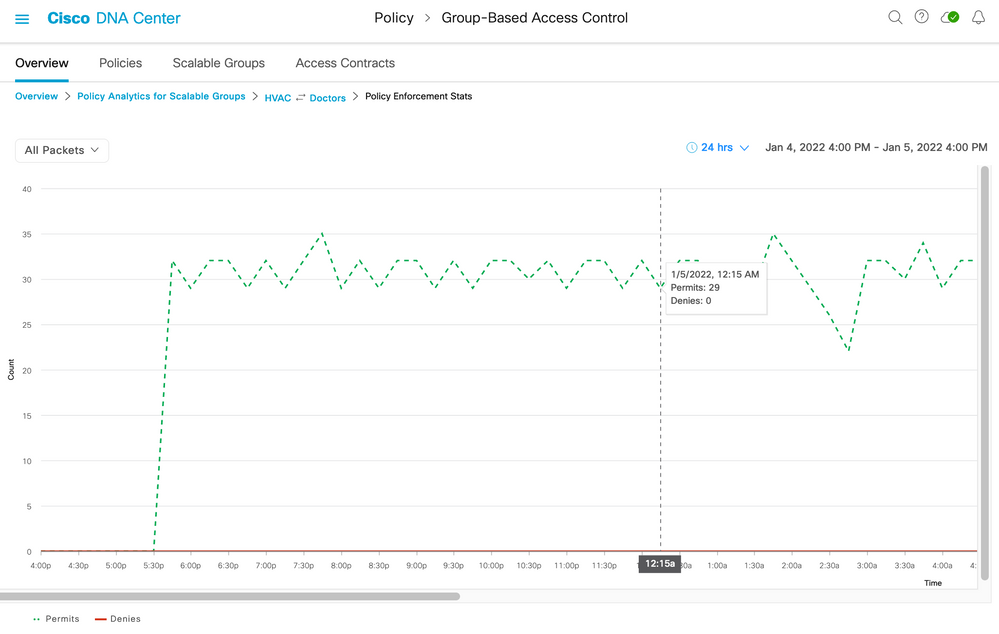
From Figure 38, there is also an option to 'View Policy Enforcement Stats'. If there is a policy deployed and the network devices are counting the permit and deny hits, then Cisco DNA Center retrieves these counters. These are not only displayed within the Overview menu but also here in graph format:
Note: the red line depicting denies is at 0 as this particular contract was permitting only. If the graph is clicked on anywhere along the timeline then the associated flows and contract are displayed:
ISE Profile Groups

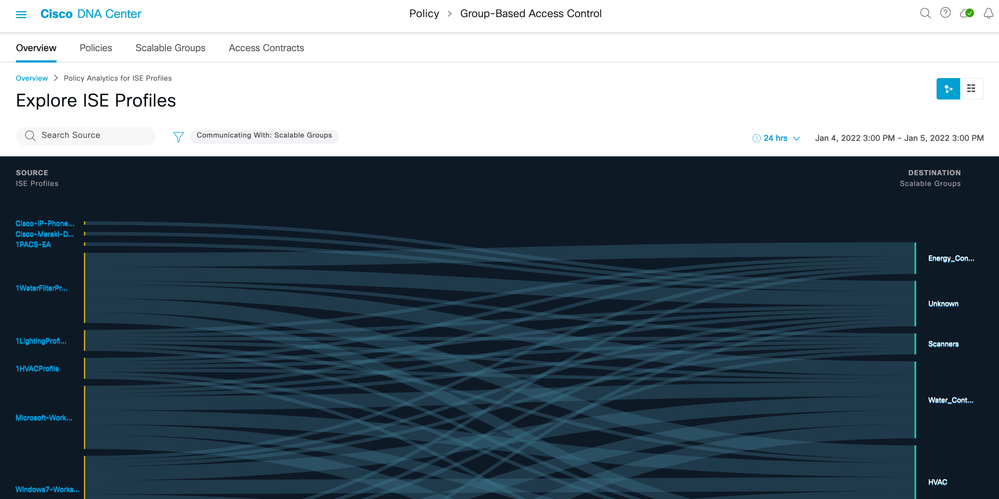
Stealthwatch Host Groups

Search Function
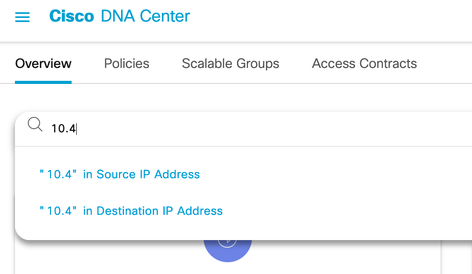
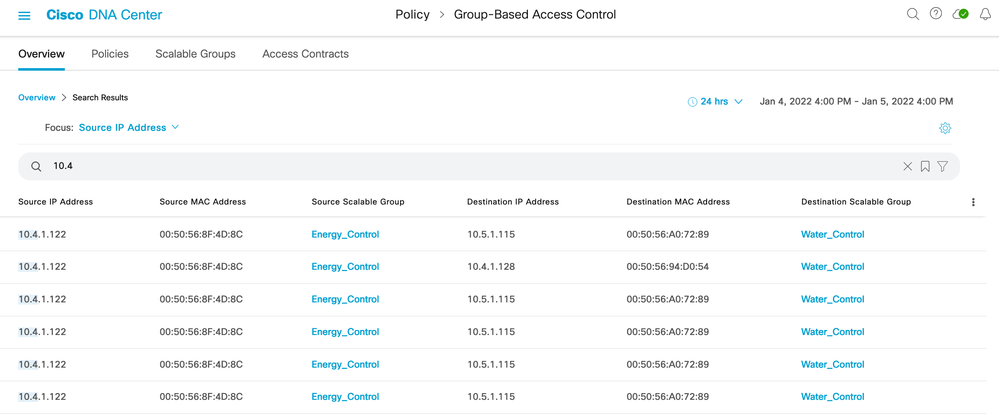
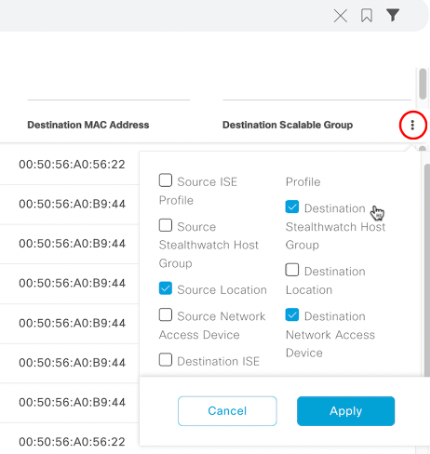
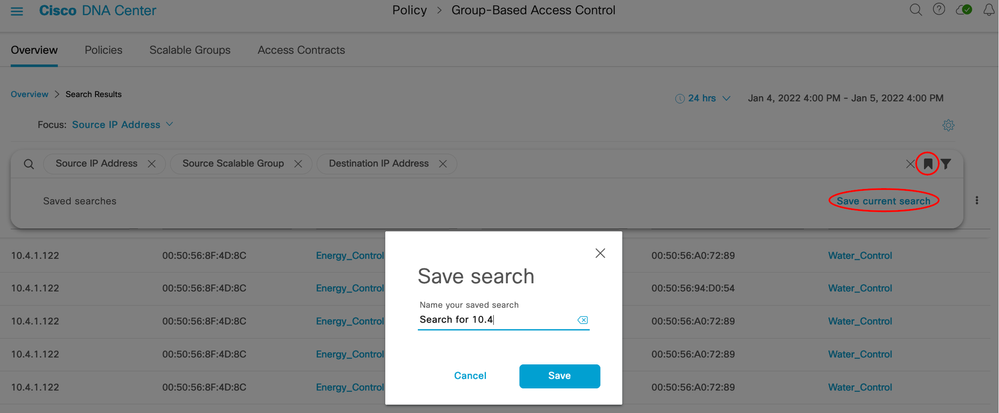
IP addresses, group names, and/or MAC addresses can be searched in the Overview tab search bar:


Deployment Guide Summary
The Group-Based Policy Analytics application can now be seen as an integral part of Group-Based Access Control. It provides an understanding of group to group communication patterns and visualization into the ports and protocols needed in access control, or Group-Based policies.
This guide is an aid to deploying the Group-Based Policy Analytics application as well as the components necessary to provide the solution. The guide also covers design aspects and operation of the system.
Appendix
List of Acronyms
AAA Authentication, Authorization and Accounting
DNA (Cisco) Digital Network Architecture
FQDN Fully Qualified Domain Name
ISE Identity Services Engine
LAN Local Area Network
MFC Multi Factor Classification
SDA Software Defined Access
SGT Scalable Group Tag
SSA Stealthwatch Security Analytics
UDP User Datagram Protocol
WLAN Wireless Local Area Network
WLC Wireless LAN Controller
- Mark as Read
- Mark as New
- Bookmark
- Permalink
- Report Inappropriate Content
So Useful
Find answers to your questions by entering keywords or phrases in the Search bar above. New here? Use these resources to familiarize yourself with the community:
