- Cisco Community
- Technology and Support
- DevNet Hub
- DevNet Data Center
- Data Center Knowledge Base
- Nexus Dashboard Deployment
- Subscribe to RSS Feed
- Mark as New
- Mark as Read
- Bookmark
- Subscribe
- Printer Friendly Page
- Report Inappropriate Content
- Subscribe to RSS Feed
- Mark as New
- Mark as Read
- Bookmark
- Subscribe
- Printer Friendly Page
- Report Inappropriate Content
11-08-2022 09:18 AM - edited 11-08-2022 10:04 AM
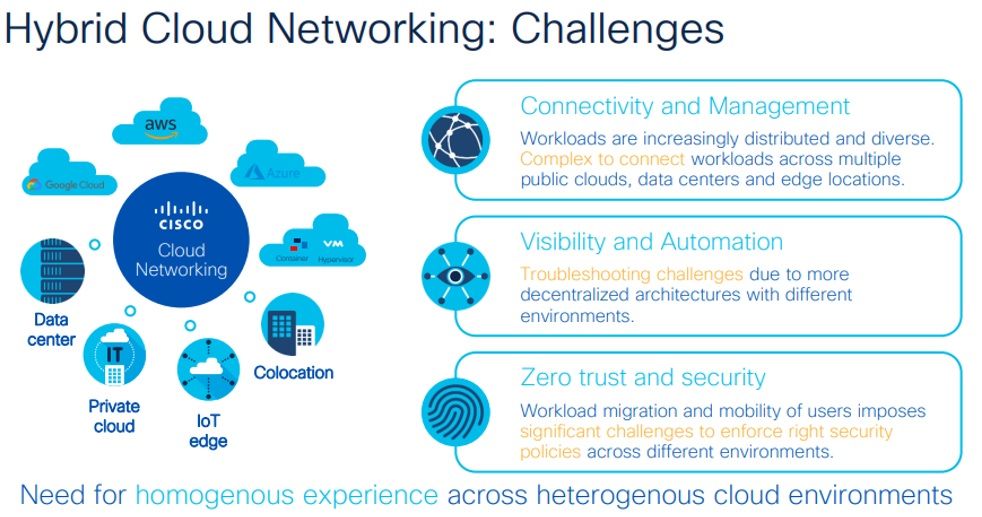
Data Center management and monitoring requirements are rapidly changing. It is becoming more complex and demanding, which creates challenges for any IT operations. SLAs need to address challenges like avoiding downtime and meeting scaling requirements. In today’s IT world, the top priority is to Automate and scale. To achieve this, we need to have complete visibility of the infrastructure.
The main challenge faced today by datacenters is:
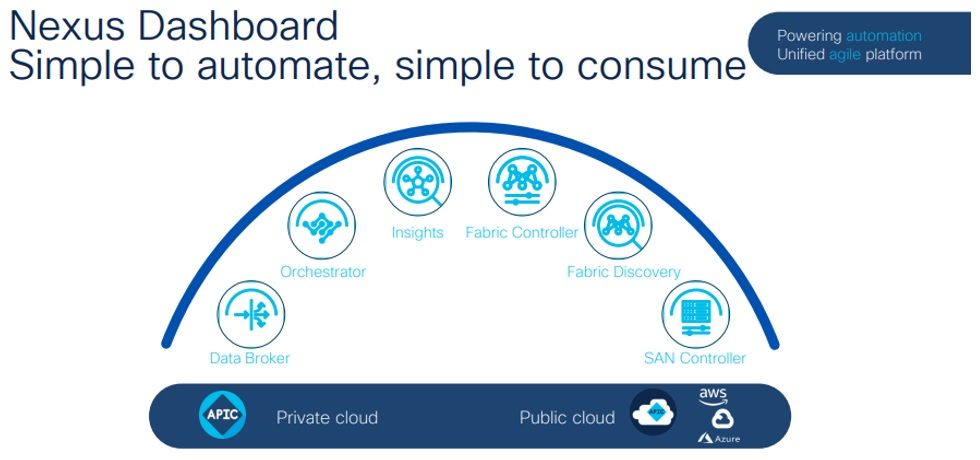
There are lots of tools available to solve this issue. But they are all in bits and pieces. You can use the Cisco Nexus Dashboard platform for centralizing the monitoring of all the services such as Nexus Insights and Nexus Assurance Engine, Nexus Dashboard orchestrator, Nexus Dashboard Fabric controller etc. All the services could be combined over the Nexus Dashboard platform, which supports single sign on. In short, you can experience the entire datacenter portfolio through a single pane of glass.
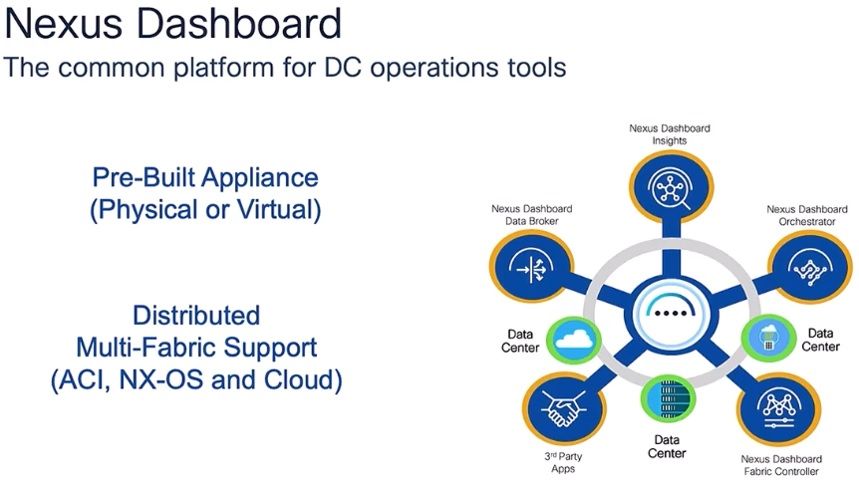
Nexus Dashboard is a hybrid cloud network services platform that allows you to consolidate and normalize your operations across different sites and the cloud. It doesn’t matter whether you run ACI or NX-OS or any third-party networks such as a public cloud.
Nexus dashboard can run on-prem as a physical or virtual appliance, or in the cloud provider of your choice. You can manage and visualize all your data center and cloud network sites, as well as information on what they’re running and the status on each devices. You can also automatically interconnect all of them together with a few clicks, normalize your hybrid cloud operations and provide consistent network and policy configurations for all your sites.
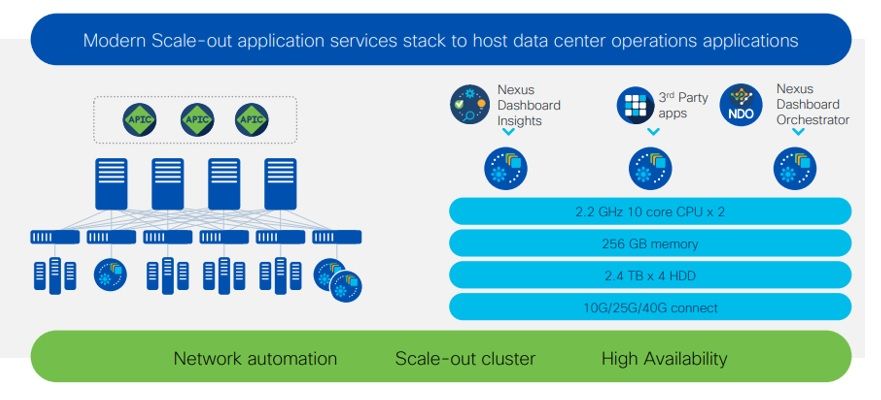
You can get Nexus Dashboard as a cluster of specialized Cisco UCS servers (Nexus Dashboard platform) with the software framework (Nexus Dashboard) pre-installed on it.
The physical version of Nexus dashboard machine will be of high performance with 256GB of Ram and more storage space as shown below.
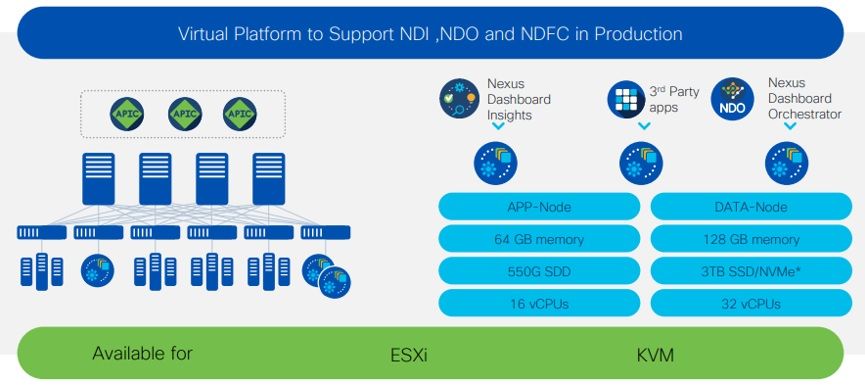
The virtual version of Nexus dashboard consists of 2 different personas. One is the application node where non data intensive applications like NDO can exist. The other is a Data node for Data intense applications. The details are shown below.
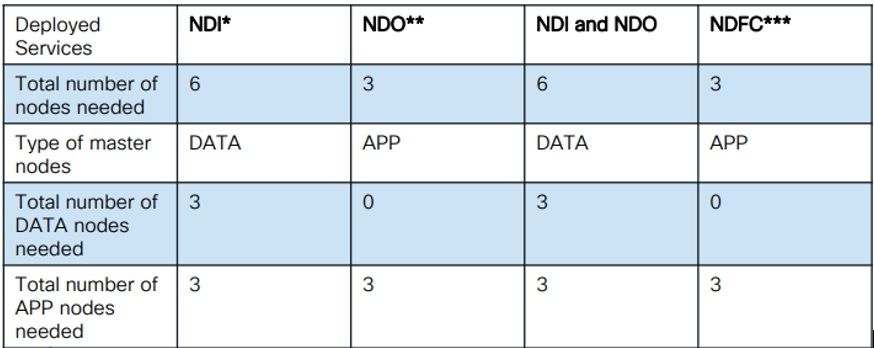
If you deploy Nexus Dashboard as a Virtual Platform you need to consider which Persona needs to be deployed as a virtual platform. Depending on the services (NDI/NDO) being deployed on top of vND the number of required nodes and which node type must be deployed as master is different. The details are given in the table below.
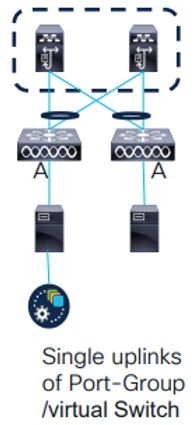
You need to plan to leverage Persistent Ips (IP address that stay with the containers even if they are migrated across ND nodes) to attach vND to the Network via UCS FI or equivalent. Plan to leverage Persistent IPs for NDI or NDFC, and in that case the virtual switch must have a single logical uplink only.
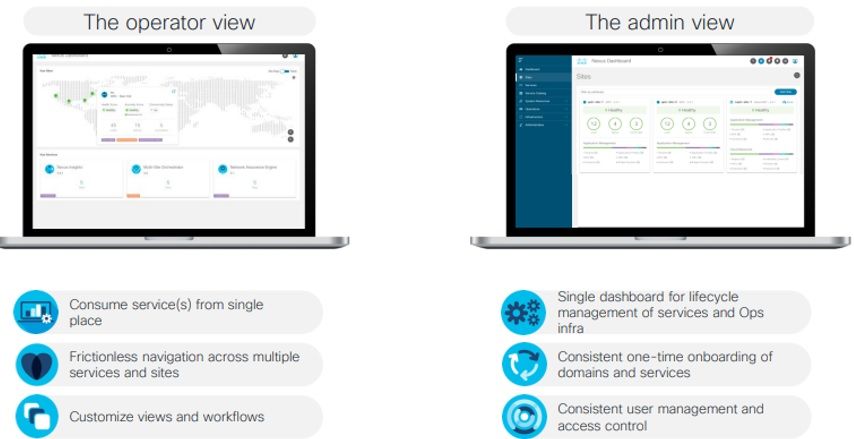
Nexus Dashboard is a Unified Agile Platform were all the services could be accessed via GUI. The features are mentioned below.
To understand the Nexus Dashboard platform deeper lets analyze the diagram below
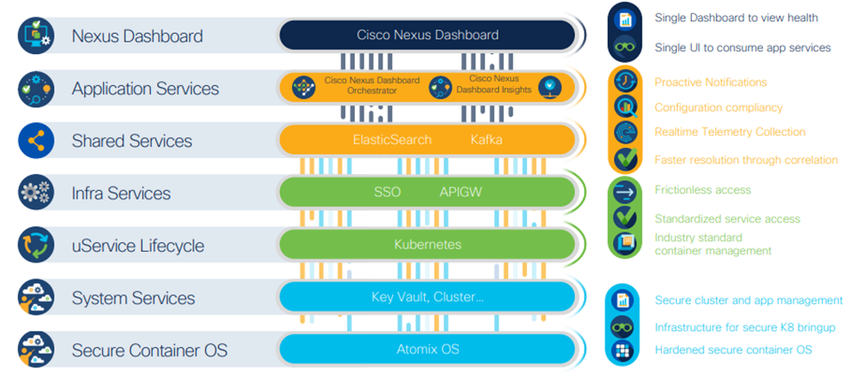
Nexus Dashboard is a container optimized platform with an operating system similar to the APIC. On top of that, the System Services helps build a cluster of the nodes. Microservices are leveraged and Kubernetes manages the orchestration of microservices. You need infra services for the dashboard cluster. The functionalities like elastic search and applications ride on top. When you need site onboarding where inventories need to brought under Nexus dashboard, the application services can be accessed as a shared service.
ND Cluster attached to ACI Fabric
The Nexus Dashboard has got two interfaces, one Data interface and one Management interface. If you want to onboard ACI fabric into Nexus dashboard you need to ensure that there is a communication path between the Data Interface of ND and ACI in-band interface and towards the ACI out-of-band interface. On the Nexus Dashboard there are two routing tables one for the management network and second one for the Data network. Select the correct routing table.

An ACI fabric is onboarded on ND by specifying the IP address of one of the nodes of the APIC cluster. This can be either the APIC’s IB or OOB address. When using NDI you must use the APIC’s IB address. ND uses the Data Interface to establish the initial connection to that APIC’s IP address. If the connection is successful, ND discovers all the OOB and IB IP addresses for the other nodes in the APIC cluster.
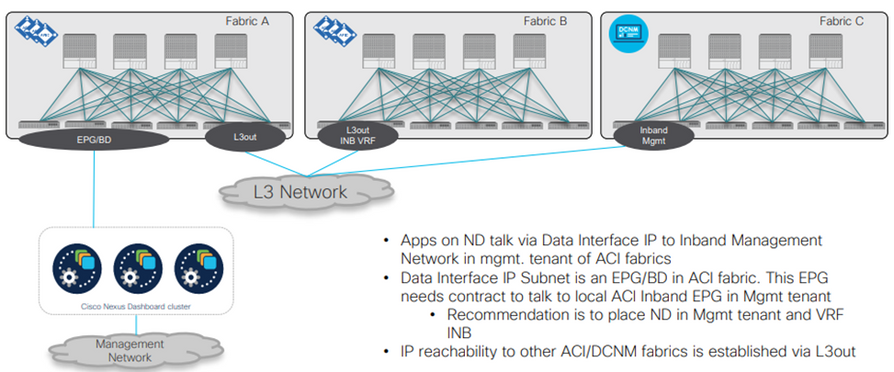
ND Cluster attached to DCNM/NDFC based Fabric
If you want to onboard an NDFC based fabric, then you need to ensure that the data interfaces of the ND clusters were the NDFC Cluster is running can communicate with each other.

An NDFC based Site is onboarded on ND by specifying the Data IP address of one of the nodes of the ND cluster hosting NDFC. ND uses the Data Interface to establish the initial connection to that ND hosting NDFC IP address.
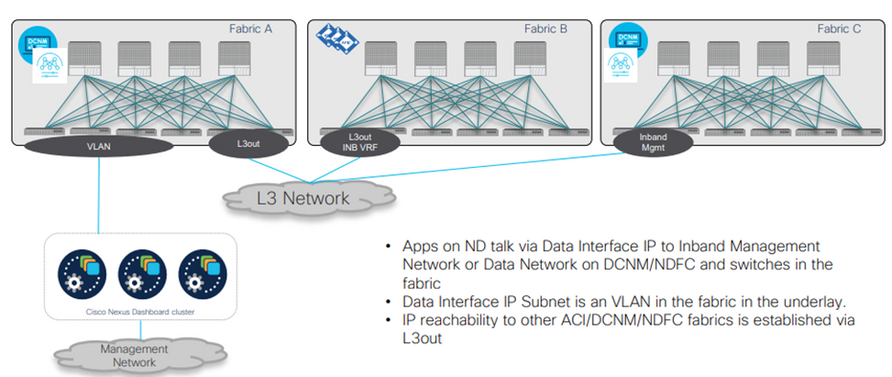
Deployment Options for ND
Each Nexus Dashboard cluster typically consists of 3 master nodes. In addition, you can provision several worker nodes to enable horizontal scaling and standby nodes for easy cluster recovery in case of a master node failure.
Deployment Requirements
- • There should be more than 1 Site
- Number of ND clusters is driven by number of switches and combination of apps
- Location of the ND clusters is driven by the type of the apps:
- NDO: cluster should be distributed for HA/DR reasons
- NDI, NAE: cluster can be distributed, but should be placed close to source of telemetry data
- Always keep virtual ND for NDO in consideration, to satisfy the HA/DR requirement
- Please check the sizing calculator for ND for the supported apps and scale on CCO
The number of required nodes and which node type must be deployed as master depends on the services (NDI/NDO) being deployed on top of vND. You can find the documentation here - https://www.cisco.com/c/dam/en/us/td/docs/dcn/tools/nd-sizing/index.html
You can on-board multiple Cisco ACI and Cisco DCNM fabrics on ND as individual sites for the same cluster. Once the fabrics are on-boarded, the applications running on the same Cisco Nexus Dashboard cluster can use them. Before you begin deployment check that Fabric connectivity is already configured.
Let’s have a walkthrough of the GUI setup for Nexus Dashboard.
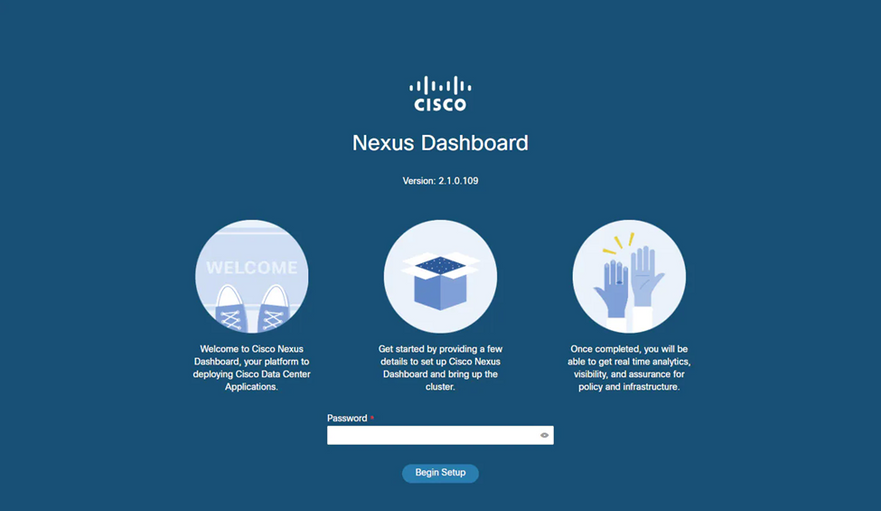
Click on Begin Setup
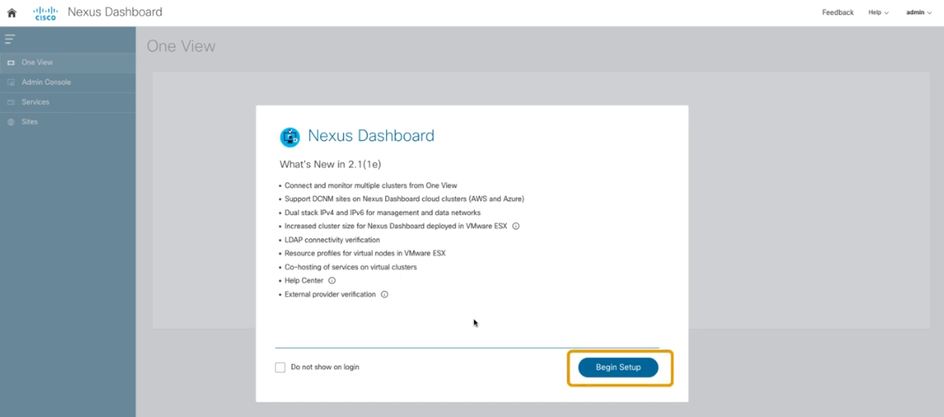
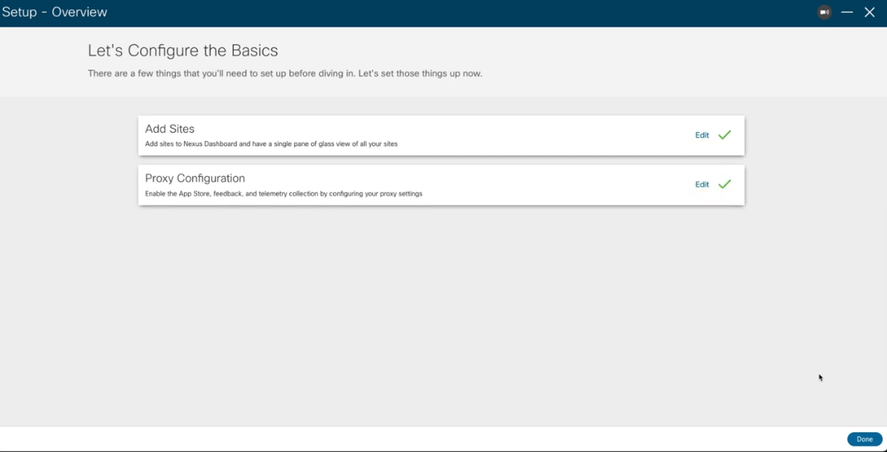
Here click on Begin Setup again to Add Sites
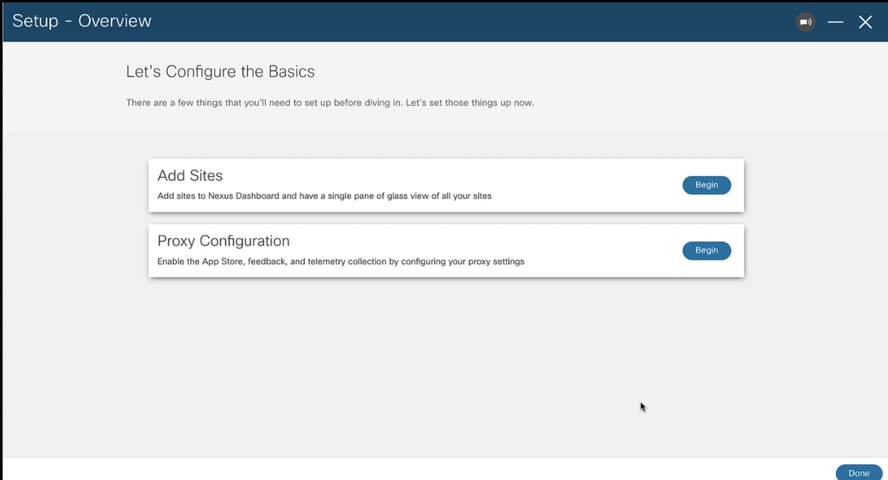
When you click on Begin button against the Add Sites option will open a window as shown below.
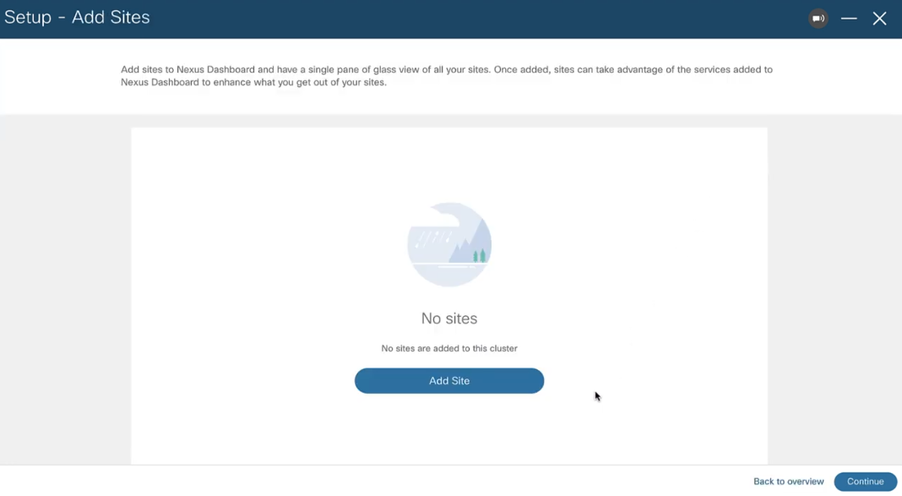
Click on the Button Add Site which will open the window as shown below. (A site is a geographical datacenter location with 1 or more fabrics)
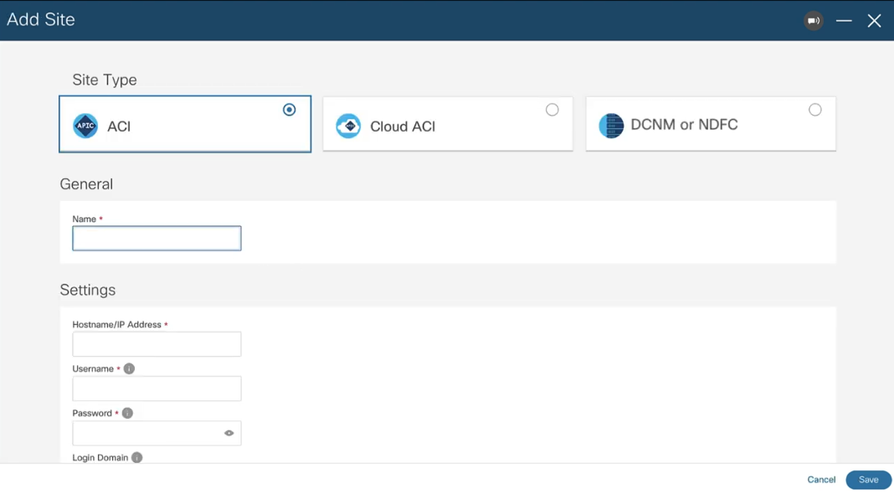
To add a site, you need its controller’s management IP address and credentials. The Cisco Nexus
Dashboard nodes must have IP reachability to the site’s controller’s management IP. The login
credentials are not stored in the Cisco Nexus Dashboard cluster and are only used to copy the SSL
keys to the sites' controllers. Sites added to the Cisco Nexus Dashboard cluster are not enabled in
the apps by default, so you will need to explicitly enable directly from each app’s own GUI.
Below we can see the already added site details.
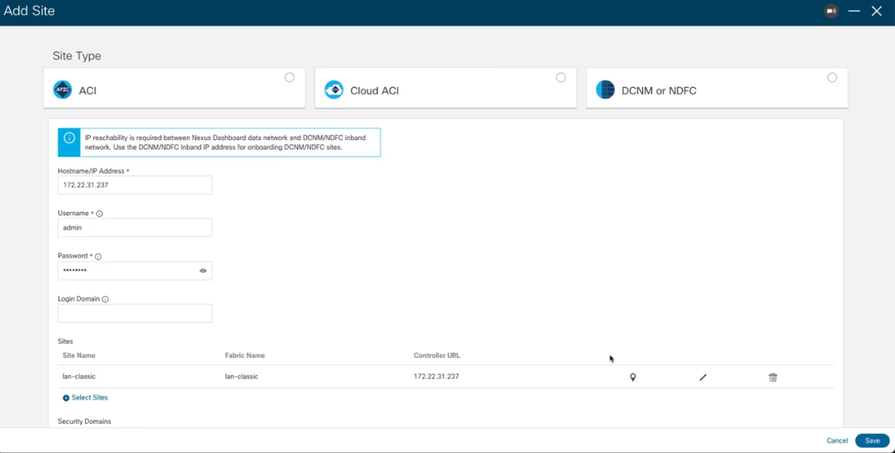
If you click on the Geographical Location map you can see where the site is located.
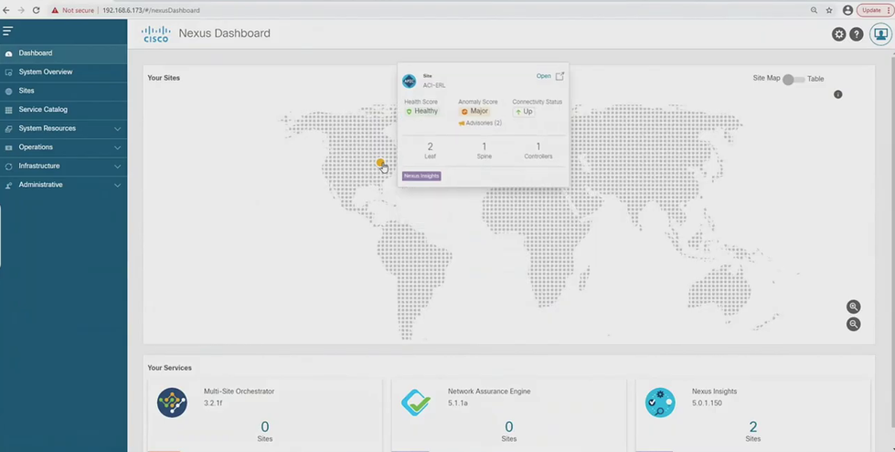
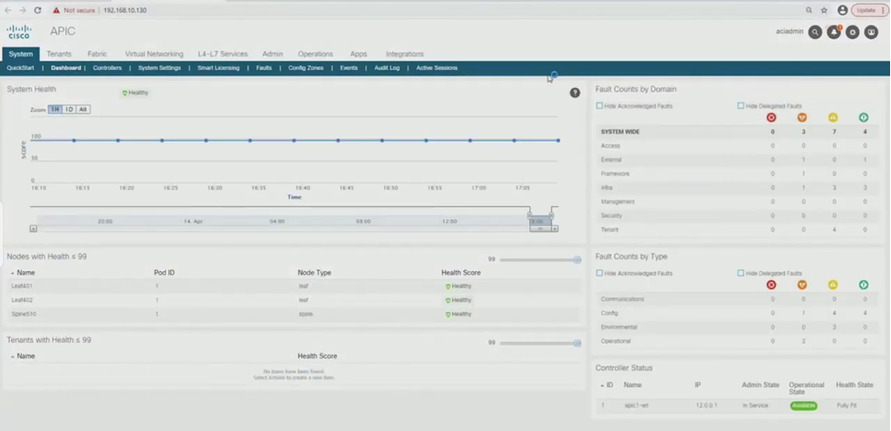
By clicking the pop-up, you may access the APIC Controller.
Next option If you want Internet connectivity then for that you need to Begin proxy configuration.
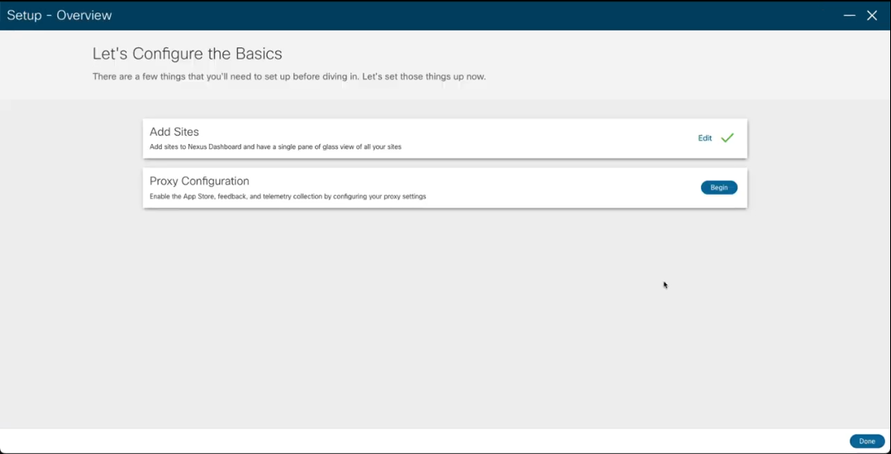
This will open a page as below.
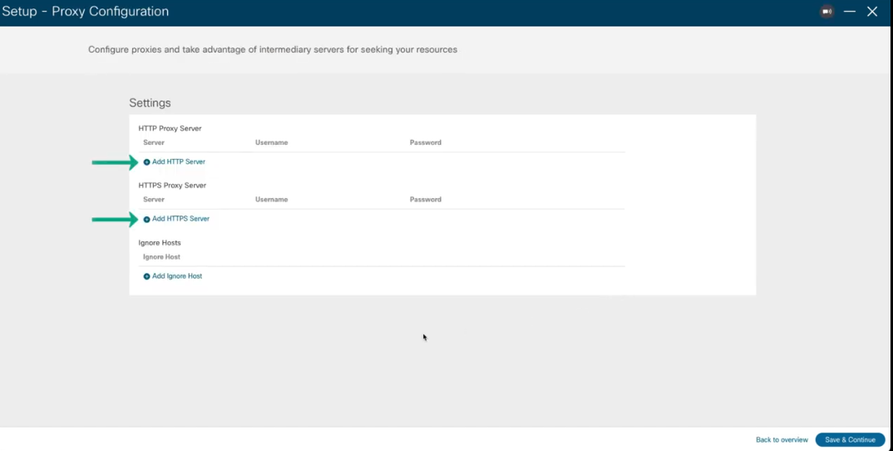
Select the option which you choose for reaching the internet via proxy.
Fill out the username and password as shown below.
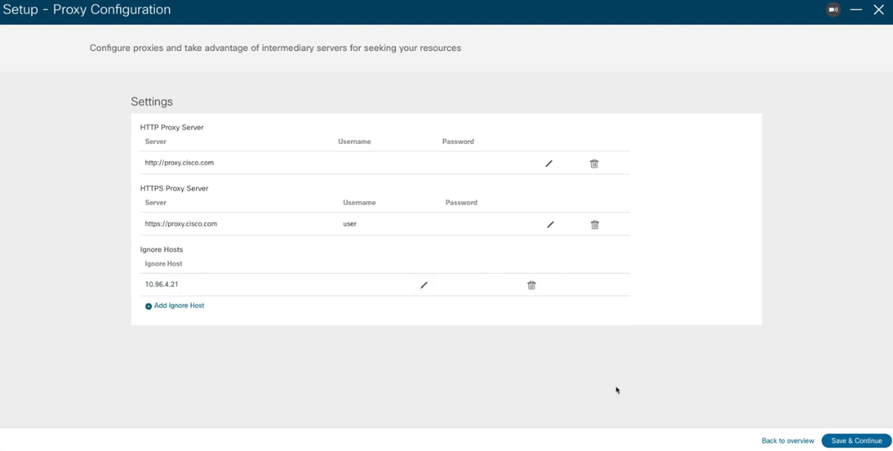
That’s it. Nexus Dashboard will attempt to reach the proxy from the routing table of the POD/Service that is trying to use the proxy.
Once the initial configuration done, you have deployed the Cisco Nexus Dashboard cluster. Next, you can perform all remaining actions using its GUI.
To access Cisco Nexus Dashboard GUI, simply browse to any one of the nodes' management IP addresses:
https://<node-mgmt-ip>
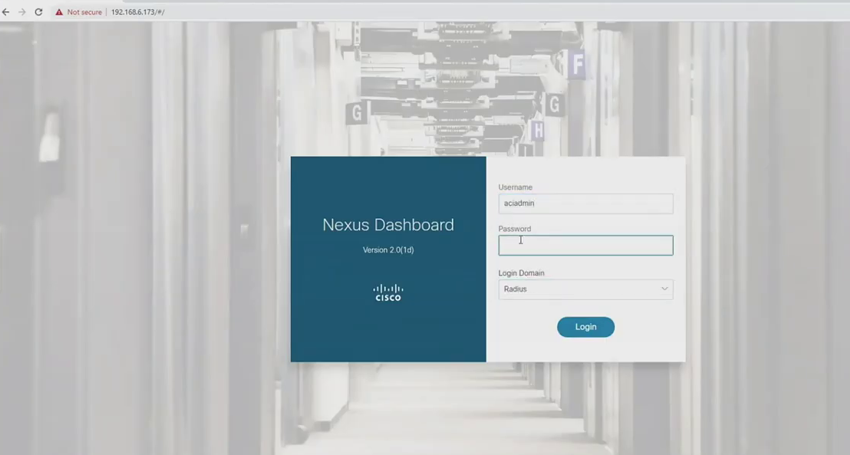
The Dashboard provides a wholistic view of the Cisco Nexus Dashboard. You can use this view to monitor system health, sites, and apps connectivity status.
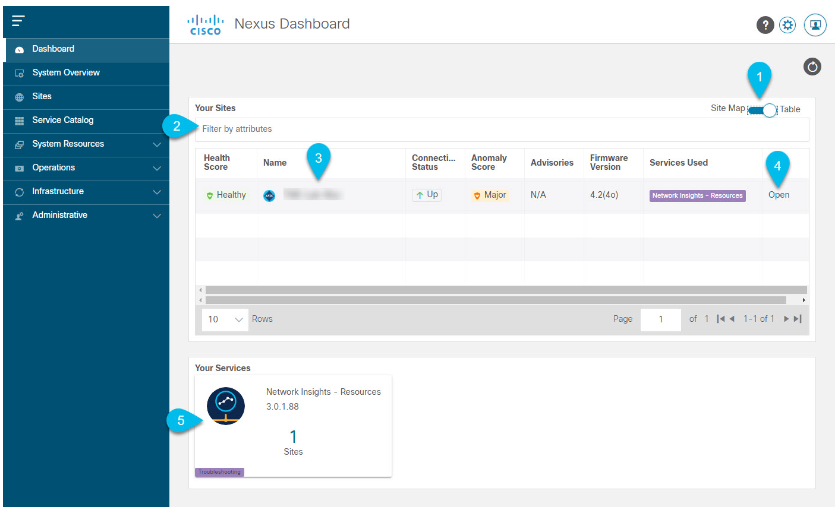
The Dashboard view contains the following information:
1. You can toggle the Site Map view to change between the geographical view and the detailed list
of available sites.
2. The Filter by attributes field allows you to filter the list based on one or more attribute-value pairs.
- You can click the site Name to open a Details pane that contains additional information such as IP addresses of the site’s controllers, its inventory, etc.
- You can click the Open link to open the GUI for the site’s controller, such as APIC, Cloud APIC, or DCNM.
- Similarly, clicking an application in the Your Services area will open that application’s GUI.
Summary
I hope this blog has helped you understand everything you need to do before deploying Nexus dashboard. You need to have a plan for the applications that you are going to run on Nexus Dashboard, such as the number of sites you are going to have and the scale of each site. Then you must do the sizing and placement of the nodes. Consider what kind of communication passage needs to be enabled. Based on the above, you can deploy Cisco Nexus Dashboard.
This article was created based on the cisco live presentation [source : Deploying Nexus Dashboard in your Organization]
References
- https://developer.cisco.com/nexusapi/
- https://www.cisco.com/c/en/us/td/docs/dcn/nd/2x/hardware/cisco-nexus-dashboard-hardware-setup-guide-2x.html
- https://www.cisco.com/c/en/us/td/docs/dcn/nd/2x/deployment/cisco-nexus-dashboard-deployment-guide-2x.html
- https://community.cisco.com/t5/data-center-and-cloud-knowledge-base/cisco-nexus-dashboard-resources/ta-p/4396211
- https://www.cisco.com/c/en/us/products/collateral/data-center-analytics/nexus-dashboard/q-and-a-c67-744374.html
- Sandbox - Nexus Dashboard Orchestrator
Find answers to your questions by entering keywords or phrases in the Search bar above. New here? Use these resources to familiarize yourself with the community:
This community is intended for developer topics around Data Center technology and products. If you are looking for a non-developer topic about Data Center, you might find additional information in the Data Center and Cloud community
