- Cisco Community
- Technology and Support
- Networking
- Networking Knowledge Base
- Cisco AI Endpoint Analytics - Deployment Guide
- Subscribe to RSS Feed
- Mark as New
- Mark as Read
- Bookmark
- Subscribe
- Printer Friendly Page
- Report Inappropriate Content
- Subscribe to RSS Feed
- Mark as New
- Mark as Read
- Bookmark
- Subscribe
- Printer Friendly Page
- Report Inappropriate Content
03-29-2021 06:15 PM - edited 10-03-2022 08:21 PM
Cisco AI Endpoint Analytics – Deployment guide
This deployment guide is meant for Cisco AI Endpoint Analytics adoption for customers, partners and everyone focusing on Endpoint Visibility and to how achieve it with Endpoint Analytics. It has sections that discusses integration with ISE for policy enforcement and best practices to define segmentation policies for SDA.
This does not cover topic such as Authentication Authorization and Accounting or full SDA integration that is currently beyond the scope of this document.
Dated: 9/9/2022
- Cisco AI Endpoint Analytics – Deployment guide
- Overview
- Data Sources
- Deployment Types
- Endpoint Analytics - Solution Requirements (minimum support)
- Application Status Checks
- Verify Service checks post installation
- Verify Logging
- ISE setup
- ISE Profiling configuration
- ISE and DNAC integration
- Provisioning of Network Device ( Cat9k / Cisco Traffic Telemetry Appliance)
- Connect to Machine Learning(ML)/AI Cloud Services
- AI Cloud registration
- Enabling DNAC as Netflow Collector (needed for ML data collection)
- Enabling netflow on network devices (needed for ML data collection).
- SD-AVC(Software Defined Application Visibility Control) setup
- Catalyst 9200/9300/9400
- IOS-XE image installation/upgrade
- Upgrade steps
- Enable CBAR ( Controller Based Application Recognition)
- Cisco Traffic Telemetry Appliance
- Physical connections
- Cisco Traffic Telemetry Appliance Connections
- Cisco Traffic Telemetry Appliance pre-configuration
- Adding Telemetry Box to DNAC inventory
- Enable CBAR (Controller Based Application Recognition)
- Connect to Network Based Application Recognition(NBAR) cloud
- Start endpoint data collection from Cisco TTA
- Profiling using AI Endpoint Analytics and ISE integration
- Trust Analytics
- How is Trust Score calculated?
- Anomaly, Vulnerability and Threat detection
- Concurrent MAC Detection
- Changing Profile Labels
- NAT Mode detection
- Unauthorized Open port and Weak credential scan:
- AI Spoofing Detection
- Rapid Threat Containment
- Adding ANC policy for AI spoof detection
- For DNAC v 2.1.x you will see the following Endpoint inventory screen.
- Adding Custom Profiling policy in ISE
- Policy and Segmentation tips and best practices
- Creating Authorization policy in ISE with Custom Profiles
- Troubleshooting tips
- Appendix 1: Cisco Traffic Telemetry Appliance bootstrapping
- Appendix 2: ML data collection configuration checklist
- Glossary:
Overview
IT organizations are challenged with protecting endpoints and IOT devices everyday. New IOT devices get connected everyday and these are pretty much unknown so it is hard to protect them and provide them right level of access to the network. Visibility is the first step towards securing an endpoint. Key to endpoint visibility is the ability to successfully identify and classify different types of Endpoints that are IT and IOT devices.
Cisco AI Endpoint Analytics is a solution that detects and classifies endpoints/IOT devices into different labels such as (Endpoint Type, Hardware Model, Manufacturer, OS Type). This can be called as Multi-Factor Classification (MFC) or assigning multiple labels to endpoints. A big advantage in doing this to categorize endpoint by variety of ways that can be used in enforcing access policies from ISE.
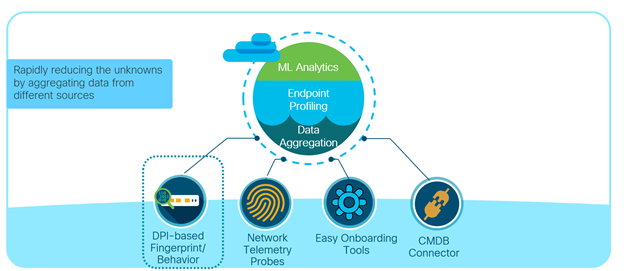
AI Endpoint Analytics engine and the user interface runs on Cisco DNA Center on prem. It assigns labels to endpoints upon receiving telemetry from the network and other sources. Here is a diagram showing Multi-Factor Classification(MFC)
Cisco AI Endpoint Analytics uses three key sources of endpoint meta data.
- Using Deep Packet Inspection from Cat9k and/or Telemetry sensor
- ISE discovery mechanism and probe data
- Asset information from external databse (Service NOW (Configuration Management Database))
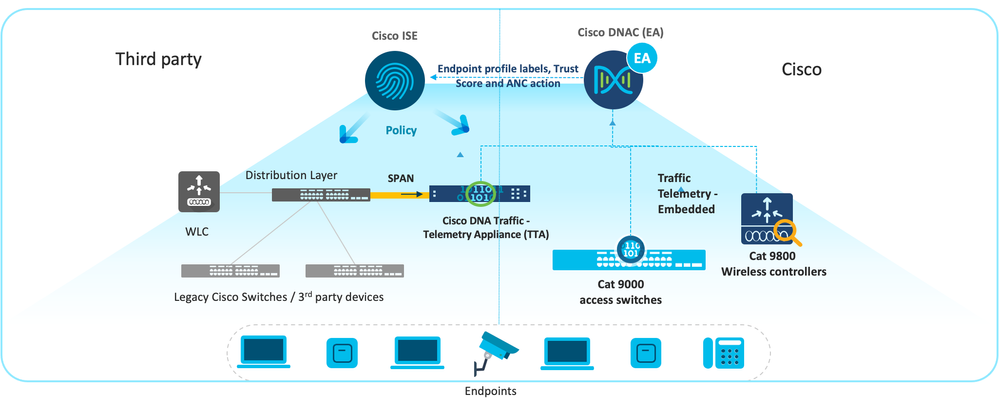
Endpoint meta data collected by turning on the deep packet inspection capability in the network infrastructure (Cat9k acess switches, Catalyst 9800 WLC, Cisco Traffic Telemetry Appliance), endpoint information is also learnt from ISE. These metadata are fed into DNAC and Endpoint Analytics profiles these endpoints for assigning labels to IT and IOT devices as mentioned above. Here is a sample deployment picture with Endpoint Analytics that will give you an idea of components included.
AI Endpoint Analytics upon assigning labels sends the context over to ISE for authorization. ISE uses these labels to create custom profiles to be used in Authorization policies. These authorization policies are policy decision points to enforce network access across the enterprise.
Data Sources
Deep Packet Inspection from Cat9k/Cisco Traffic Telemetry Appliance:
Network Based Application Recognition(NBAR2), is an embedded technology built-in to switches (e.g.: Cat9k access switches) that can detect and analyzes Layer 7(Application layer) packet data from a variety of IT and IOT protocols(around 1500 protocols) along with specific network and transport layer information from associated endpoints.
These protocols include standard application protocols used in enterprise(e.g.: browser, email, chat, voice/video). Enterprise IOT devices expands from carpeted to non-carpeted space where building security and building automation devices reside. NBAR2 supports a range of IT and IOT protocols such as Building Automation protocols(BACNET), IOT Messaging(MQTT etc.), mDNS (Multicast protocols) and other protocols. For Healthcare it supports DICOM, HL7 etc. used for imaging and electronic records storage and retrieval etc.
Further, Software Defined Application visibility Controller (SDAVC) agent collects endpoint information from the network using CDP/LLDP and SNMP.
NBAR2 can also be used for application visibility/QoS in Cisco DNA Center and is supported in variety of platforms(Cat9k access, Cisco Traffic Telemetry Appliance (TTA). In this document we will focus on use of NBAR2 towards Endpoint visibility.
Telemetry Sensor is nothing but Cisco TTA appliance running IOSXE. This is meant to replace Cat9k DPI functionality as explained above when using legacy or 3rd party switches that does not have NBAR2 embedded. This is used to collect network traffic using SPAN/Tap connections from the distribution switch.
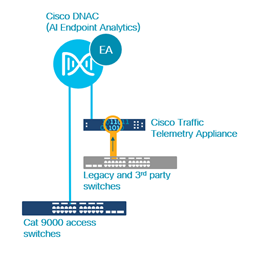
The diagram below is a very simplified representation of the topology that has both Cat9k and Cisco Telemetry Traffic Appliance sending information to Cisco AI Endpoint Analytics.
ISE Discovery Mechanism and probe data:
Identity Services Engine is a software appliance used for visibility and profiling IT assets and Network Access control. It collects endpoint meta data from IT systems using traditional protocols such as RADIUS, DHCP, SNMP etc. to detect IT assets in an enterprise. ISE probes such as Active Directory, Mobile Device Manager, Anyconnect(ACIDEX extensions) provides additional value to the asset information gathered by Endpoint Analytics.
Service NOW (Configuration Management Data Base – CMDB)
Service NOW is a configuration management database that is a repository of asset information in an enterprise. Endpoint Analytics will have the capability to only receive asset information from Service NOW and in future will provide bi-directional support. Endpoint Asset information from Service Now can be used by Endpoint Analytics to profile an endpoint.
Deployment Types
AI Endpoint Analytics can be deployed in the following ways and their combinations.
Here is an example of Wired network topology with Cat9k Access switches.
Here is the same topology using Cisco TTA (Telemetry Sensor) via legacy switches/non-Cisco switches
Endpoint Analytics - Solution Requirements (minimum support)
- Management: Cisco DNA Controller (2.1.2.x)
- Policy and Access: Cisco ISE 2.4 P11 or ISE 2.6 P5 or ISE 2.7 P1 or higher
- Network Devices : Cat 9200/Cat 9300/9400 and Cat9800 WLC(IOSXE 17.3.1), Cat9800 WLC (IOSXE 17.7.1 (SDA Fabric)
- Legacy/3rd part Network devices: Cisco Traffic Telemetry Appliance (IOSXE 17.3.1)
The Cisco AI Endpoint Analytics deployment guide documentation is not an install guide for DNAC. For full installation of DNAC please check
Application Status Checks
Following are list of quick checks to make sure Endpoint Analytics and associated packeges are installed and running.
1. When DNAC is installed and connected to the network, you will see a login message displayed.
Welcome to the Maglev Appliance
Log in with the maglev user from the CIMC console or connect using an SSH session to the host IP address as assigned during the installation and destination port 2222.
maglev-master-1 login: maglev
Password:
[Type in Cisco DNA Center CLI password assigned during installation]
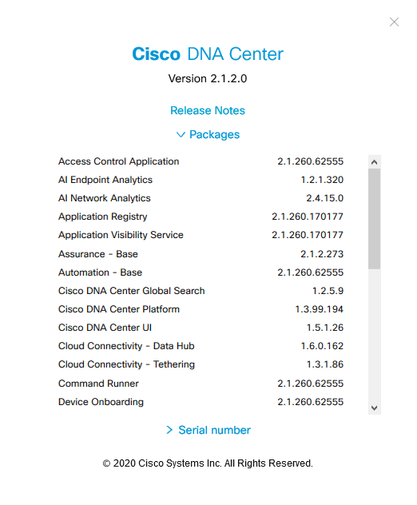
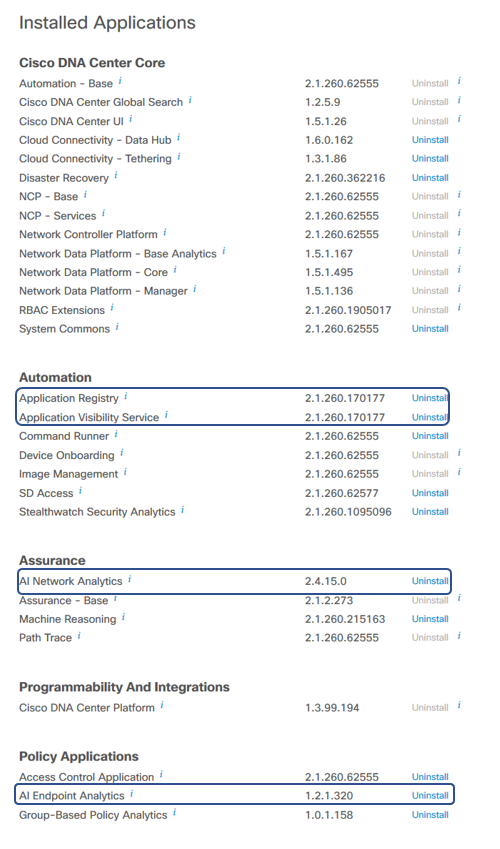
2. Login to the DNAC UI and go to left top of the screen, click on ?, click About and from the window, click packages to open. You will see the key packages listed as in the screenshot below. Package version varies depending on the DNAC version.
3. You can also check installed applications by going to Hamburger Menu > System > Software Updates > Installed Apps page and check that all 3 key applications that installed “AI Endpoint Analytics”, “AI Network Analytics” and “Application Visibility Services” installed.
Verify Service checks post installation
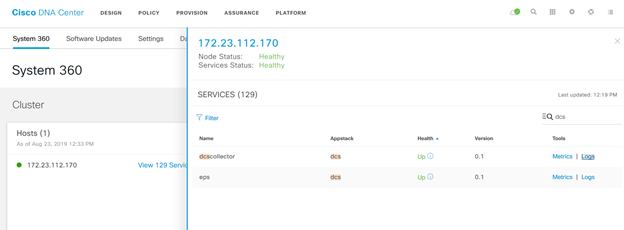
- From DNAC UI, Go to System > System 360. Under Cluster:Hosts, click on the # services.
- Find Kairos agent (ai), collector-ise (ise), endpoint analytics(eps), SDAVC Server (avc). The status of those service should be ‘UP’. If you hover on the information icon near’UP’ you will see the service status and version number. Make note of the versions.
(Optionally) If you find the services not running.
Login to the DNAC CLI using SSH.
- Execute the following commands to verify if the package is deployment and service is running.
The versions should be as in the “About” section in the UI discussed above and the status should show deployed.
$ sudo maglev package status
[administration] username for 'kong-frontend.maglev-system.svc.cluster.local': admin
[administration] password for 'admin':
maglev-1 [main - https://kong-frontend.maglev-system.svc.cluster.local:443]
NAME DISPLAY_NAME DEPLOYED AVAILABLE STATUS PROGRESS
---------------------------------------------------------------------------------------------------------------------------------------
access-control-application Access Control Application 2.1.260.62555 - DEPLOYED
ai-network-analytics AI Network Analytics 2.4.15.0 - DEPLOYED
app-hosting Application Hosting - 1.4.244.200727 NOT_DEPLOYED
application-policy Application Policy - 2.1.260.170177 NOT_DEPLOYED
application-registry Application Registry 2.1.260.170177 - DEPLOYED
application-visibility-service Application Visibility Service 2.1.260.170177 - DEPLOYED
assurance - Base 2.1.2.273 - DEPLOYED
….
….
endpoint-analytics AI Endpoint Analytics 1.2.1.320 - DEPLOYED
group-based-policy-analytics Group-Based Policy Analytics 1.0.1.158 - DEPLOYED
….
…
ssa Stealthwatch Security Analytics 2.1.260.1095096 - DEPLOYED
system 1.5.208 - DEPLOYED
system-commons System Commons 2.1.260.62555 - DEPLOYED
umbrella Cisco Umbrella - 2.1.260.592206 NOT_DEPLOYED
wide-area-bonjour Wide Area Bonjour - 2.4.260.12079 NOT_DEPLOYED
[Mon Oct 12 21:04:36 UTC] maglev@10.1.100.110 (maglev-master-10-1-100-110) ~
$ ^C
You can use other commands to check the appstack (magctl appstack status), service (magctl service display) for troubleshooting.
Verify Logging
Verify the logs from Settings >System 360. Click on Services and endpoint-analytics
To follow/tail the current log of any service, execute the following command in the CLI
magctl service logs –r -f <service-name
ISE setup
This guide assumes that Cisco ISE is already in production /lab and not already integrated with any Cisco DNA Center instance.
Endpoint Analytics service requires ISE to be installed/upgraded to one of the supported versions / patch levels. This a pre-requisite for DNAC integration with ISE
- 2.4 Patch 11+
- 2.6 Patch 5+
- 2.7 Patch 1+ and ISE 3.0+
- ISE 3.1 and beyond
ISE 3.1 provides greater integration with Endpoint Analytics and we recommend to have this if possible. It exposes unique attributes from AI Endpoint Analytics in ISE authorization policy to create conditions using attributes from Endpoint Analytics dictionary.
ISE setup should have been configured for authentication, authorization for 802.1x/MacAuthBypass for onboarding the endpoints to provide basic level access pre-authentication and post-authentication.
ISE Profiling configuration
First and foremost, make sure that the “Profiling” service is enabled in ISE and network devices are configured to send probes to ISE. Refer to the following document for further details: ISE Profiling Design Guide
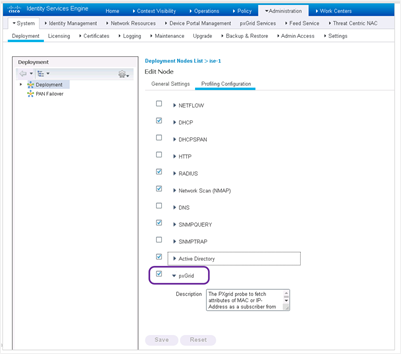
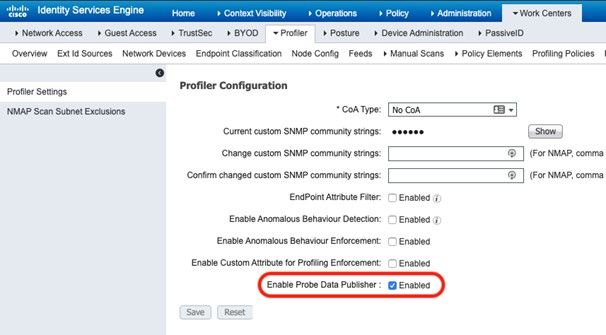
- Enable Probe Data Publisher on ISE.
- Login to ISE GUI as admin user.
- In ISE admin portal, navigate to Administration > System > Deployment. Go to Node, Select the ISE Node, click Edit Node option. Go the Profiling Configuration tab and select pxGrid probe. This is used to gather incoming profiling labels from Endpoint Analytics service in Cisco DNA Center.
- Go to Work Center -> Profiler -> Settings and check the Enable Probe Data Publisher checkbox entry with default as disabled. Save the changes. This is needed to ensure ISE publishes endpoint data.
ISE and DNAC integration
To integrate Cisco ISE and Cisco DNAC, please make sure DNAC can use ISE Fully Qualified Domain Name (please update DNS host/pointer records for ISE for this to function) while adding ISE as AAA server in DNAC. This needs DNS to be configured in the environment. Adding ISE server, creates a pxGrid certificate in ISE that has DNAC MAC address in the Subject Alternate Name(SAN).
Use the following documentation for DNAC to ISE integration
Few key steps to remember. Turn on ISE pxGrid service, and pxGrid probe.
- Go to Administration > System: Deployment > Edit Node, select PxGrid service.
- Go to Profiler Configuration tab and enable PxGrid probe
- From Administration > Settings > ERS Setting, enable ERS
Make sure ISE IP/FQDN are in the certificate and is DNS resolvable.
If you have ISE 3.1 and beyond, following configuration is needed for exposing Endpoint Analytics attributes in ISE 3.1 authorization policy.
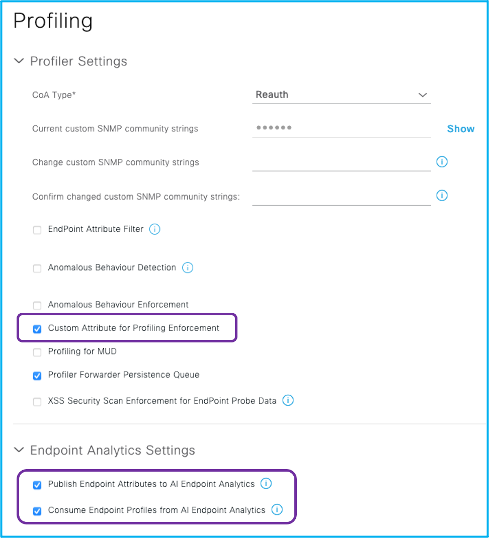
Ask ISE to publish endpoint asset information to AI Endpoint Analytics via pxGrid and also to consume information from AI Endpoint Analytics so that the attributes are visible in Authorization policy conditions. Here are the steps to configure this in ISE.
- Navigate to Work Centers > Profiler > Settings.
- Select the options, Publish Endpoint Attributes to AI Endpoint Analytics and Consume Endpoint Profiles from Endpoint Analytics (if not already selected).
Note: Turn on Endpoint Attribute Filter as part of ISE profiling best practices.
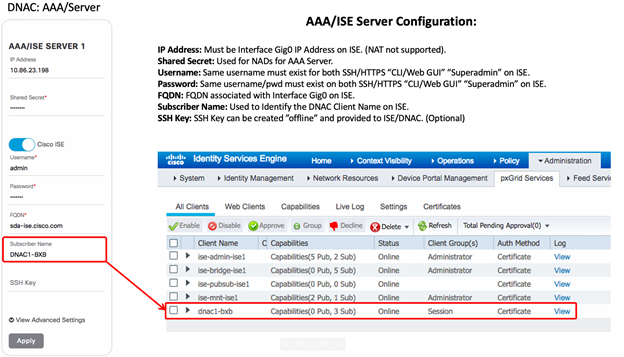
In DNAC, Add ISE from DNAC Settings, go to menu > System> Settings > External Services. Click on Authentication and Policy Servers. Click Add.
Fill in the form with IP address, Shared Secret and type in ISE admin user credentials. Under subscriber, type in a name for pxGrid client (choose the name wisely). Once you add it you will see the Status “IN PROGRESS” that is updated to “ACTIVE”
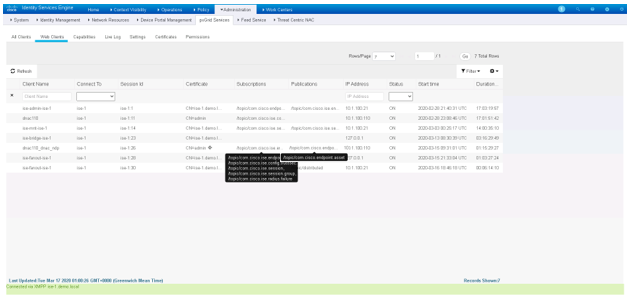
You would see the following in ISE UI, when you go to Administration > pxGrid Services. Notice that the “dnac” has new publications “endpoint asset”. This is meant to send the classifications back to ISE.
Approve the “DNAC” pxGrid clients if they are Pending from the “All Client’s” tab.
Status of ISE will be ACTIVE in DNAC after you approve the client.
Note: If you are using versions of ISE before ISE 3.0, make sure you approve the “DNAC” pxgrid clients if they are Pending from the “All Client’s” tab (pre ISE 3.0).
Post ISE 3.0, you will see pxGrid clients listed under Administration > pxGrid Services >Client Management >Clients.
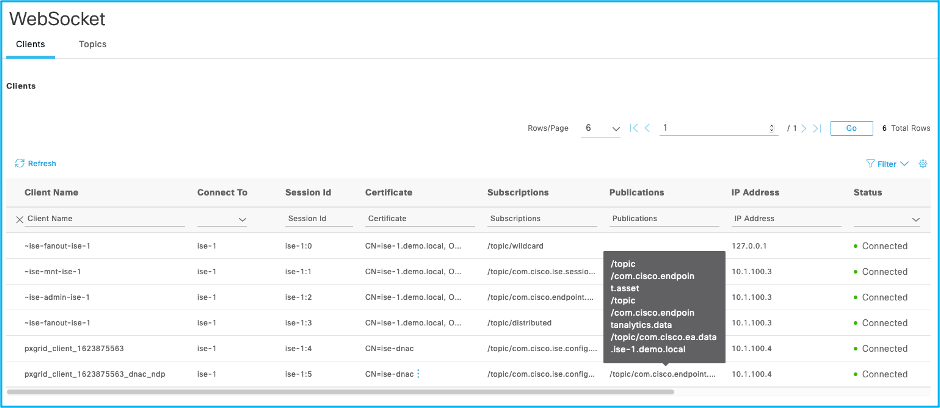
Next, under Administration >pxGrid Services, go to Diagnostics tab, go to Websockets > Clients you will see the pxGrid clients mentioned above.
Hover over the Subscriptions for pxgrid client that has ndp as suffix, you will see a box that should show all topics subscribed that should have /topic/com.cisco.ise.endpoint.
Now hover over the Publications for pxgrid client listed that has ndp as suffix, you will see a box that should show all topics Published by DNAC that should have you should see /topic/com.cisco.ea.data.<ISE FQDN>. This topic is used to send the profile labels back to ISE. ISE uses this topic to receive profile labels, CMDB attributes and Trust Score from Cisco DNA Center.
You will see the topic published once you enable the two options to publish and subscribe to Endpoint Analytics topics in ISE.
Provisioning of Network Device ( Cat9k / Cisco Traffic Telemetry Appliance)
As a pre-requisite, if you have Cat9k access switches or Cisco TTA, the network device(s) need to be managed and SD-AVC configuration provisioned by the Cisco DNA Center Appliance.
Make sure to back up your network device configuration before provisioning.
- Turn on snmp-server community public RO on cat 9k
- vty settings to support all transport
Before you configure SDAVC make sure you turn on AI Cloud so that the probe data is passed to ML for learning.
Connect to Machine Learning(ML)/AI Cloud Services
All connections to the cloud are outbound on TCP/443; no inbound connections (our Cloud will not be initiating TCP flows towards Cisco DNA Center).
Fully Qualified Domain Name (FQDN) to allow/whitelist in the HTTPS proxy and/or firewall is:
- api.euc1.prod.kairos.ciscolabs.com (API Endpoint)
Cisco DNA Center must also be able to perform DNS lookups for the cloud server addresses.
Connections to our cloud servers may also go through a proxy (explicit or transparent) if required. The proxy server setting, if any, is inherited from Cisco DNA Center.
AI Cloud registration
For Machine Learning(ML) to be enabled, DNAC should be tethered to the AI cloud. This needs cloud communication that requires cloud registration.
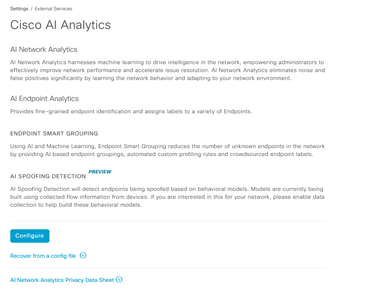
Once the steps above are completed, go to the Cisco DNA Center appliance web UI to complete the AI Cloud registration:
- System > Settings > External Services > Cisco AI Analytics
-
Click on Configure and enable Endpoint Smart Grouping and AI spoof detection option.
Endpoint Smart Grouping uses AI/ML cloud to cluster unknown endpoint to help admins label the endpoint. This is very useful to reduce the net unknowns in the network.
AI spoof detection is an option that helps Cisco gather netflow information from your network(when enabled) and helps in modeling the endpoint.
Choose the right region based on your location. The cloud connection verification is done and you will see a green checkbox when the connection is successfull.
Note: If the connection is unsuccessfull, check your proxy settings in DNAC by going to System > Settings > System Configuration > Proxy config
- Mark the checkbox to accept the Cisco Universal Cloud Agreement terms and click on “Enable”:
Once the registration is completed a pop-up message will show up:
Enabling DNAC as Netflow Collector (needed for ML data collection)
In DNAC, Click Menu > Design > Network Settings and enable telemetry for DNAC to collect netflow. Enable DNAC as collection server if the network devices sends the flows to DNAC else use the option to add a different netflow collection server.
Enabling netflow on network devices (needed for ML data collection).
This is supported in Cat9k access switches. This is used for ML to collect data for modeling.
Go to Menu > Provision > Inventory > Select the site, the switch.
Click Actions dropdown > Telemetry > select Enable Application Telemetry. This enables netflow on all the ports. If you want to selectively do it only on certain ports use the following CLI commands. You can also add descriptions to the switchports use key words ‘lan’, that will push the configuration only to those ports.
Manually configured netflow on the device
Interface GigabitEthernet1/0/13. --- access ports
ip flow monitor fnf-avc-mon input
ip flow monitor fnf-avc-mon output
flow exporter DNAC
destination 10.62.140.77 DNAC IP
transport udp 6007
option interface-table timeout 10
option vrf-table timeout 10
option sampler-table
option application-table timeout 10
option application-attributes timeout 10
flow monitor fnf-avc-mon
exporter DNAC
cache timeout inactive 10
cache timeout active 60
record fnf-avc-ipv4
flow record fnf-avc-ipv4
match ipv4 version
match ipv4 protocol
match application name
match connection client ipv4 address
match connection server ipv4 address
match connection server transport port
match flow observation point
collect flow direction
collect connection initiator
collect connection new-connections
collect connection client counter packets long
collect connection client counter bytes network long
collect connection server counter packets long
collect connection server counter bytes network long
collect timestamp absolute first
collect timestamp absolute last
Please see Appendix-2 at the end of the document for a complete check list of items that needs to be configured and verified.
SD-AVC(Software Defined Application Visibility Control) setup
SD-AVC service on supported IOS-XE platforms facilitates aggregation of the telemetry and connects to Cisco DNAC to provide high fidelity classification of endpoints.
SD-AVC can be deployed with the following network devices:
- Cisco Catalyst 9200/9300/9400 and Cat9800 wireless controller( from IOSXE 17.7.1)
- Cisco Traffic Telemetry Appliance ( IOSXE version: IOS-XE 17.3.1). These are used as Telemetry boxes to capture SPAN traffic in the aggregation layer if your network has legacy Cisco network devices or third party.
Catalyst 9200/9300/9400
IOS-XE image installation/upgrade
Customers using Cat9k and SD-AVC functionality to gather telemetry from the endpoints should upgrade the switches to IOS-XE-17.3.1 version. This should be in advance before deploying and integration of DNAC/Endpoint Analytics service.
Upgrade steps
- Follow the instructions below to upgrade the switch:
- Once device is rebooted, check show version output is showing DNA Advantage license.
#sh version
Technology Package License Information:
-----------------------------------------------------------------
Technology-package
Current Type Next reboot
------------------------------------------------------------------
network-advantage Smart License    network-advantage
dna-advantage Subscription dna-advantage
The switch should be configured for 802.1x / MacAuthBypass. MacAuthBypass allows ISE to authenticate using the MAC address of the IOT devices but will allow or deny access based on authorization. Profiling is used to identify and classify the IOT device that will be reauthorized to provide the right level of access.
Enable CBAR ( Controller Based Application Recognition)
Following steps describes steps to add a network device to DNAC, provision the configuration and enable the CBAR.
- Follow the instructions below to Discover and add your network device(s) to the Cisco DNA Center Inventory:
- Go to Settings -> Device Controllability and check its Enabled
- Go to Provision -> Devices -> Inventory and add the device under a site.
- Provide the CLI and SNMP credentials needed to connect and go to enable mode. Wait till device is added successfully.
- Go to Provision -> Services -> Application Visibility and go to bottom of page to see device details.
- Select device and Enable CBAR from the top of the table, wait for deployment to be completed. In certain cases, when the certificate is not installed corrected while provisioning or when the
- Connect to switch and check SD-AVC status “CONNECTED”
Cat9k-DNAC-DCS#sh avc sd-service info summary
Status: CONNECTED
If Endpoint Analytics and DNAC does not get SD-AVC data, it could be a provisioning error. If the network device was managed by another DNAC server, then you need to clean up the certificate from the switch and add it again. Here is one way clean up the certificate.
- Remove the Cat9k from DNAC.
- Cleanup the DNAC trustpoints in switch using 'no crypto pki trustpoint DNAC-CA' command.
- Cleanup SD-AVC configuration on switch using 'no avc sd-service' command.
- Add the Cat9K to the DNAC and check its managed.
- Enable Application visibility and check it shows Enabled.
- Connect to switch and run following command to check it shows Connected for SD-AVC.
Cat9k-DNAC-DCS#sh avc sd-service info summary
Status: CONNECTED
Cisco Traffic Telemetry Appliance
This is an appliance from Cisco that gathers telemetry using Deep packet inspection where you have legacy and 3rd party network devices. This requires Layer 2 traffic to be sent to the appliance for NBAR and Deep packet Inspection.( Appliance has the PID for ordering: DN-APL-TTA-M.)
Physical connections
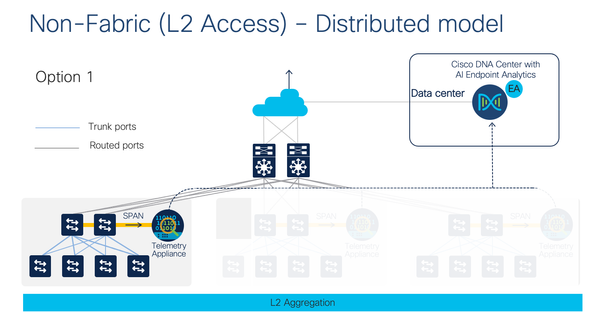
If using Cisco TTA, this need to be connected to the distribution layer via typically 1 SPAN port( L2 Traffic, Discovery) for a single distribution switch.
Cisco Traffic Telemetry Appliance Connections
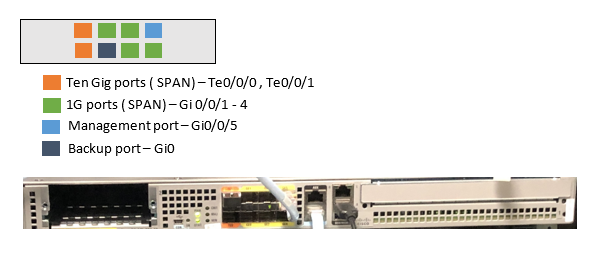
Below you can find information on ports and connections used in Cisco Traffic Telemetry Appliance(Cisco TTA). The blue cable in the chassis picture was connected to GE1 when the picture was taken. This need to be connected to GE0 as shown in the connection diagram below).
Typically the 2 * 10G interface is used for SPAN on Cisco TTA. Gi0/0/5 is configured as a management port with an IP address to talk to Cisco DNAC
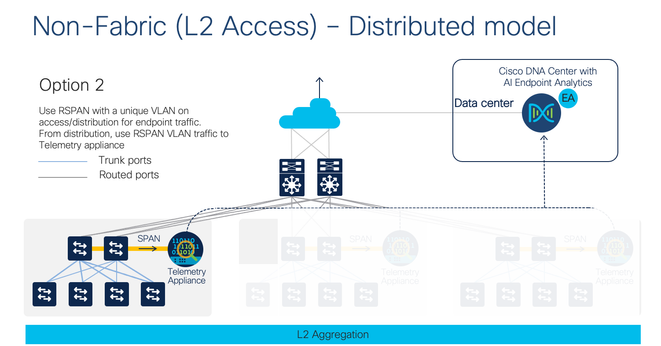
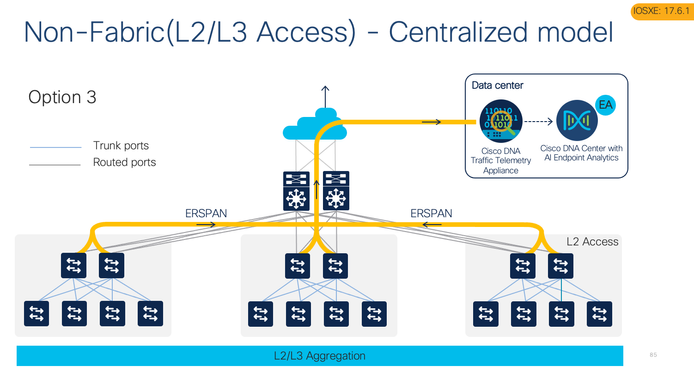
If you have multiple distribution/aggregation points in your network you can use both the 10G or four 1G ports for mirroring your traffic via SPAN and send endpoint/IOT Layer 2 traffic from different VLANs. You can also use RSPAN or ERSPAN wherever possible depending on the use case.
RSPAN is used when you have overlapping VLAN infrastructure and if you want to use a unique VLAN for this traffic(L2).
ERSPAN is used if you want to locate the Cisco TTA appliance in a central location and you can terminate the ERSPAN on central switch or Cisco TTA across a Layer 3 network.
Cisco TTA also supports decapsulating CAPWAP for wireless traffic and VXLAN using Fabric.
Note: Cisco TTA supports up to 40,000 endpoints in an appliance.
Cisco Traffic Telemetry Appliance pre-configuration
Allow endpoint’s VLAN’s in the SPAN or remote SPAN from your distribution switch. Note that VLAN 1 is used to send discovery(CDP, LLDP) traffic. From your aggregation switch enable SPAN using following commands. If your IOT endpoints are in VLAN 10, 20, 30 configure the following. The example below shows gigabit Ethernet port. Same configuration applies to Ten Gig ports as well. You can use VLANs or Interfaces as source.
switch(config)#monitor session 1 source vlan 1, 10 , 20 , 30 both
switch(config)#monitor session 1 destination interface gigabitEthernet 1/0/x
To verify:
switch#do show run | inc monitor
monitoring
monitor session 1 source vlan 10 , 20 , 30
monitor session 1 destination interface Gi1/0/x
On the Cisco TTA, Gi0/0/5 is used for management, to send Telemetry data to DNAC.
Here are the commands you need to execute on the appliance before adding to the DNAC inventory.
(config)#hostname Cisco-TTA
Cisco-TTA(config)#enable password <password string>
Cisco-TTA(config)#aaa new-model
Cisco-TTA(config)#aaa authentication login default local
Cisco-TTA(config)#username admin privilege 15 password 0 cisco
Cisco-TTA(config)#snmp-server community <string> RO
Cisco-TTA(config)#snmp-server community <string> RW
Cisco-TTA(config)#int gi0/0/5
Cisco-TTA(config)#description ****Management interface******
Cisco-TTA(config)#ip address <IP address> <Subnet Mask>
Cisco-TTA(config)#cdp enable
Cisco-TTA(config)#end
Cisco-TTA# conf t
Cisco-TTA(config)#ip nbar classification tunneled-traffic capwap
Building configuration….
Adding Telemetry Box to DNAC inventory
Cisco TTA can be managed from DNAC. Currently you cannot change configuration on the appliance but check the status of the appliance, configuration, ports etc.
Go to Menu, Provision -> Devices -> Inventory and add the device under a site. If you don’t have a site, create one by going Design > Network Hierarchy menu.
- Provide the username/password(CLI) and SNMP community needed to connect and password enable mode. Wait till device is added successfully.
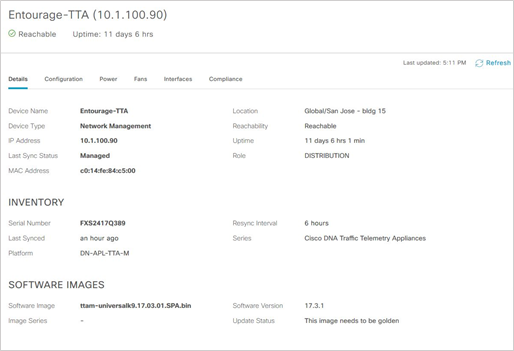
- Check the Device Name, Family (Network management), Reachability - Reachable, Manageable, Device Role - Distribution. Device will be Non-Compliant, once it is fully provisioned the “Non-compliant” status will change.
Note: The serial number should be updated, Device Series is Cisco DNAC Traffic Telemetry Appliances.
If you double click the Device Name entry for e.g: Entourage-TTA, it opens a screen that let you see overall appliance status.
Note: For Endpoints to be visibility is Endpoint Analytics, the network device connected to the Endpoint should be added in the DNAC inventory. This requirement is being addressed in the future DNAC releases/patches. Endpoints will not be visible in EA without this step.
Enable CBAR (Controller Based Application Recognition)
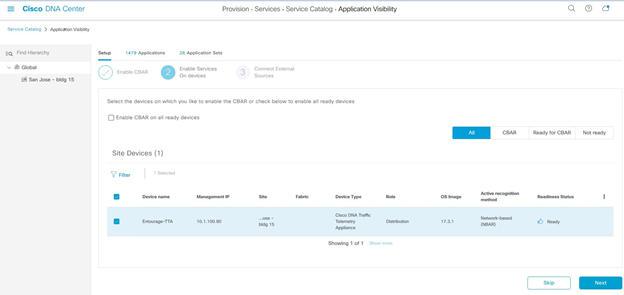
Go to Menu, Provision > Application visibility, if this is the first time you are in application visibility you have to go through a wizard shown below. Select the device to enable CBAR and proceed to next step. If not, select the device from the list and click ‘Enable CBAR’ button.
Once CBAR is enabled, the deployment status will show completed.
You can verify if AVC(Application Visibility Control) service is enabled in the box, by logging into the Cisco Traffic Telemetry Appliance and executing following CLI command.
Cisco-TTA#sh avc sd-service info summary
Status: CONNECTED
Device ID: Cisco-TTA
Device segment name: AppRecognition
Device address: 10.1.100.90
Device OS version: 17.03.01
Device type: DN-APL-TTA-M
Active controller:
Type : Primary
IP : 10.1.100.24
Status: Connected
Version : 4.0.0
Last connection: *02:26:00.000 UTC Sat Sep 5 2020
Connect to Network Based Application Recognition(NBAR) cloud
Both Cat9k and Cisco TTA collects endpoint metadata using Deep Packet Inspection of packet flows. This is further sent to NBAR cloud for analysis and for detecting unknown protocol signatures. To allow this to happen, DNAC appliance need to be tethered to the cloud.
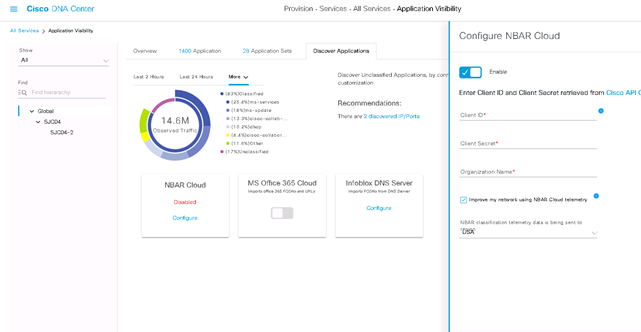
- From DNAC UI, go to Provisioning > Services > All Services > Application Visibility for this. Click Configure under NBAR Cloud and it opens a panel. Enable the service.
- If you have Client ID, Client Secret and Organization Name(Please give a unique name depending on the organization and use). Make sure the region is USA and save it.
Note: You can get this credential by clicking on “Cisco API Console” from the panel that opens up a portal. Login with you CCO id, create a new app, select the options corresponding to NBAR cloud and complete the form. At the end of it you will get a Client ID and Secret.
Start endpoint data collection from Cisco TTA
Login to the Cisco TTA appliance and from the CLI go to the interface connected to SPAN port of your distribution. Do a “no shut”, on the Gig/Ten Gig interface from the CLI.
Profiling using AI Endpoint Analytics and ISE integration
When using DNAC 2.2.3 and ISE 3.1 following 2 steps ensures DNAC and ISE are integrated to send and receive Endpoint data correctly for smooth integration.
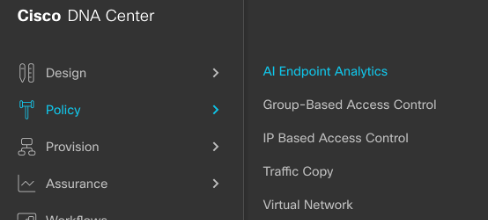
Login to DNAC with admin credentials navigate to menu > Policy > AI Endpoint Analytics
Look for ‘Configuration’ option on the top right corner (above AI) as shown in screenshot below.(applicable to DNAC 2.2.x)
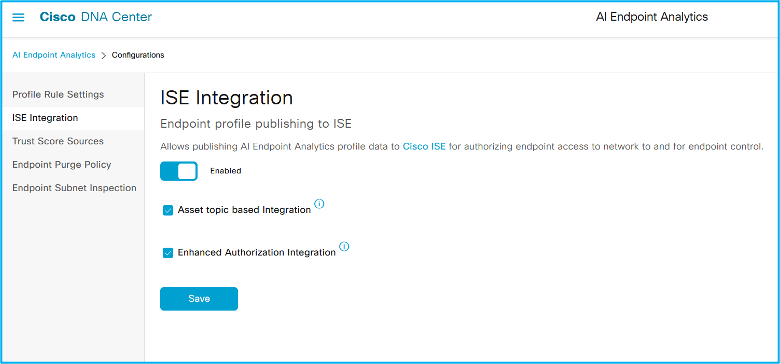
Click ‘Configuration’ and then the ‘ISE Integration’ menu from the left. You will see a screen as below. These should be enabled already in the lab pod refresh. If not enabled, please make sure you enable both the options and save it.
All version of DNAC, login to DNAC UI and go to Endpoint Analytics application You have to open the left panel by clicking the icon to the left of DNA Center from the hamburger menu
From DNAC UI: Go to Policy > AI Endpoint Analytics to start the UI.
You will see the “Total Endpoints” on the left and “AI Proposals” on the right. It takes a while for ML grouping to show enough clusters, give it a few hours.
Total Endpoints will show endpoints that are Unknown (not profiled), endpoints partially profiled ( Missing Profiles), and endpoints that are fully profiled.You will see the following screen, with Endpoints (Fully Profiled, and Missing profile labels for missing classification).
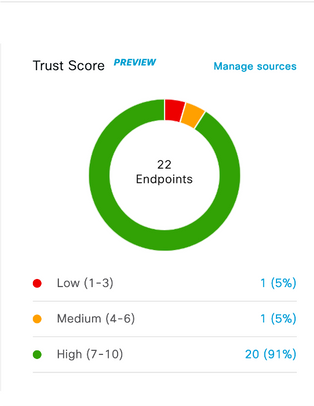
You will see the AI proposals getting populated to the right side of the screen. You will also see the Trust Score dashlet in the middle that is used in identifying Trustworthiness of an endpoint feature. We will discuss this below. Finally, in the left bottom of the overview screen you will see a dashlet with information of static and Random MAC address seen in your environment. On the top you will see 4 tabs.
'Endpoint inventory' provides a list of endpoint seen in the network.
Profiling Rules’ will give you list of rules used for profiling including Custom rules, AI Rules you create.
'Hierarchy' allows admins to create a custom hierarchy of endpoints that can be sent to Cisco ISE.
The dashlet in the middle stands for Overall Trustscore. We have several sources for Trustscore across release. Authentication, posture are sources that have positive influence on TrustScore, if posture is non-compliant then trustscore will be lowered. Same with the case of threats or vulnerability.
Endpoint Analytics have other sources or features such as AI spoof detection, Concurrent MAC address detection and Changing Profile labels which identifies MAC spoofing and Attribute spoofing attempts and generate Trust scores with low(1-3), medium(4-7) and high scores(8-10). It can detect other threats that detects weak software interface, endponit reaching to malicious websites and unauthorized endpoints NAT'ed Hosts.
Trust Analytics
The evaluation of endpoint security posture on a continual basis results in a Trust Score. The process of evaluation of endpoint security posture is called Trust Analytics.
How is Trust Score calculated?
Overall Trust Score is calculated by an algorithm that considers the prior state of endpoint’s, frequency of the alerts and aggregates the scores based on certain weights based on inputs from different sources.
In general, there are positive inputs to Trust Score as well as risk factors. Positive inputs adds to the Trust Score, risk factors removes points from the score. If your authentication is using MacAuthBypass or use MAC address list then currently it will show as medium score(6).
Note: There was a defect were endpoints that are getting authenticated via MACauthbypass was assigned low score(2). That was fixed in the latest patch.
If you have wired or wireless endpoints that authenticated using 802.1x based on authentication methods score increases further. For high secure authentication method such as EAP-TLS, EAP-Fast/PEAP(Mschapv2) score is high(8 to 9). If you still are using authentication method that is less secure (EAP-GTC, PAP/CHAP) then it will show medium score.
Risks are associated with anomalies/threats. AI Endpoint Analytics has suite of features that are used to identify anomalies, vulnerabilities and threats related to endpoints. From the Overview page, in the Trust Score dashlet, click Manage Sources, go to Trust Score Sources to see the list of supported functionalities which will help you identify various endpoint anomalies. You can enable or disable these functionalities from here.
From the AI Endpoint Analytics tabs, click on Endpoint Inventory tab; You will see 3 new columns named 'IP address', 'Trustscore' and ‘Is Random MAC’ in the table.
When you click on a MAC address, you can see a lot of details on the side panel that includes “Authentication Status”, “Authorization profile”, “Scalable Group Tag” associated and Last seen by DNAC. Most of these attributes are received from ISE after endpoint authenticates and gets an access policy. If you have MDM integration you will see the DUID associated with the endpoint received from Cisco ISE. In the side panel, you will see previous MAC addresses used incase your endpoint has Random MAC address.
Anomaly, Vulnerability and Threat detection
Cisco AI Endpoint Analytics supports following use cases as of Cisco DNAC 2.3.3.
1. Impersonation attacks: It identifies and alerts devices impersonating as authorized and legitimate devices in the network. Bad actors use spoofing to get into the network for doing this. Customers are concerned and they need to satisfy their audit and compliance needs.
You can use a suite of functions to identify this that includes following detection features "AI Spoofing detection", "Concurrent MAC address" and "Changing Profile Labels".
2. Detect Weal software Interface: It identifies and alerts weak software interface that helps bad actor to scan for open/vulnerable ports and weak login credentials.
3. NAT'ed endpoint detection: Identify and alert presence of endpoint behind a NAT'ed device ( e.g: Guest VM's inside a host that may not be authorized by IT).
4. Detecting IP reputation using TALOS: It identifies if an endpoint is reaching out to a bad reputed site that could be malicious to the end user. The site may host SPAM or malware. An alert is generated as a result.
Endpoint Analytics with DNAC 2.3.4 has a way to manage and customize alerts, create custom impact( Available from Cisco DNAC 2.3.3) to tweak the Trust Score based on customer needs.
Each of the options below can be enabled globally or locally for every endpoint from DNA Center UI.
For Global configurations, from the AI Endpoint Analytics Overview screen, Click Configuration option on the right corner and then the Trust Analytics or Trust Score Sources(before DNAC 2.3.3) menu from the left. You can also click manage sources in the Trustscore dashlet.
AI Spoofing Detection:
AI spoofing detection assists in identifying unauthorized endpoints impersonating legitimate endpoints in the network using MAC and probe spoofing techniques. This is done using cloud-generated behavior models for different types of endpoints. These models are trained using crowdsourced NetFlow data for a known endpoint type that is functioning under normal operating conditions. These are downloaded to DNA Center on a frequent basis and is updated for efficacy. When an unauthorized endpoint generates traffic that deviates from the machine learning model, an anomaly is triggered with a low, medium, or high probability of detection.
The presence of an anomaly and probability of detection is represented as a Trust Score of the endpoint. We support ML models of endpoints such as IP Phone, Printers, Cameras and other IOT devices etc.
Concurrent MAC Detection
This feature is meant to discover and alert on situations where same MAC address is seen simultaneously on the network in more than one location. This functionality is supported for wired endpoints with Cat9k access switches.
This can detect MAC addresses appearing concurrently across different switchports or across different switches. You need NBAR to be enabled on the switches for this. This functionality will work for all types of traffic(TCP/UDP) seen by the switch port.
This functionality looks at two aspects.
Collisions: How many times MAC addresses appear exactly at the same time(sampled every minute) on different ports or different switches over a 15 mins period. Alert is triggered if collision is more than 1.
Transitions: How many times MAC address keeps appearing, not at the same minute but keeps hopping back and forth, across different switchports over a 15 minute period and half hour across switches. Alert is triggered if transition is 4 or more.
Endpoint Analytics tracks the switch ID, switchport and VLAN and presents that in the UI for admins to take action on the anomaly. This anomaly triggers a low to medium Trustscore
Changing Profile Labels
Endpoint Analytics have 4 profile labels, only significant change in profile label will be considered as anomaly. Significant change in profile label may indicate an underlying condition where there is a possibility of MAC spoofing, probe spoofing or the endpoint is running a NAT’ed device behind.
What is considered a significant change? For example, if an endpoint changes from endpoint type ‘Workstation’ to ‘IP Phone’, it is considered a significant change since one or more attributes used to evaluate this has changed with high confidence.
Let us consider a second example. A change in operating system label from Windows to Linux may not be considered a significant change immediately if the change is a result of a weaker attribute such a "User agent". Attributes are stronger or weaker based on how easy it is to tamper that by an average user.
Non-significant changes in labels does not trigger an anomaly to avoid false positives. Endpoint analytics profiling engine compares the confidence level of probes(protocols) and attributes to track changes. Attributes such as LDAP/NetBIOS have higher confidence level since they are not easily manipulated. So if a label is created by a strong attribute it cannot be overridden by a conflicting weak attribute such as “User agent”. It needs a strong probe/attribute to override it or multiple probes. So if you see a change in “User agent” attribute which did not trigger this detection, you know why it is now.
NAT Mode detection
AI Endpoint Analytics will recognize the presence of a NAT device that can be used in situations where unauthorized guest VM’s are NAT’ed and get connected to the network via NAT. Presence of NAT device is calculated using TTL, change in profile labels etc. Endpoints behind the NAT’ed device will be identified with an alert message with low Trust Score.
Note: To reduce false positives, please refrain turning on CBAR on Trunk ports on your switch that carries several VLAN traffic.
Unauthorized Open port and Weak credential scan:
Endpoint Analytics can use a security sensor application to scan for vulnerable open ports and weak credentials. The Security Sensor application can be downloaded from Cat9300 section of, software download center. This can be pushed from Cisco DNA Center from Provisioning > App Hosting section to the Cat9k switches to be hosted as a container in Cat9300 switch. The application helps Endpoint Analytics scan the endpoints for unauthorized open ports in endpoints/IOT devices and also look for weak login credentials for SSH/Telnet protocols.
To install Security Sensor(SDAVC application) in Cat9k, Cisco DNAC has a wizard that will walk through the install, where admins have to select options(Fabric/Non-Fabric), switches, VLAN, IP or DHCP for the container app to talk to the endpoints.
The container creates an interface and an IP address that is used to scan endpoints and would reach endpoints using L3 connection. Once the installation is complete and the application is running you have to turn on the functionality
You have the go to Endpoint Analytics overview page, click Configuration and go to Trust Score Sources, use the slider to come down the page to section "Open port Scan".
Configuration for Unauthorized port scan: Click configuration to setup list of open ports to be scanned, then create a subset of unauthorized ports list to be scanned more deeply. You need to create a Scan task for the container app to start scanning.
Configuration for weak login credentials: Click configuration, then setup a list of credentials you want to scan. This should include common/well known username/passwords for Telnet/SSH protocols. Once the task is configured to scan, scanning will happen and complete. You have the option of tweaking the interval.
Alerts are raised in Endpoint Inventory page, when you change the focus to Trust Score you will see results from every Trust Score source(based on its availability and if it was on during that time).
AI Spoofing Detection
AI Spoof detection is an already supported feature that was part of previous release, that identifies endpoints impersonating a legitimate endpoint connected to the network.
For AI Spoof detection, AI/ ML cloud looks at the traffic patterns from different endpoints from many customers to create ML models. ML models are downloaded to Cisco DNAC are used to compare with the active traffic pattern coming from the endpoint connected to the network. Deviations from the models are detected and inference made about possible anomalies. An anomaly event is triggered with high, medium and low probability along with a Trust score that identifies the Trustworthiness of the endpoint.
The impersonating device can use different ways to do this e.g.: MAC spoofing, Probe Spoofing etc. Hence it helps identifying endpoints used for impersonating a legitimate device in the network such as IP Phones, Printers etc.
Overview screen will show a dashlet to show endpoints and their Trust scores.
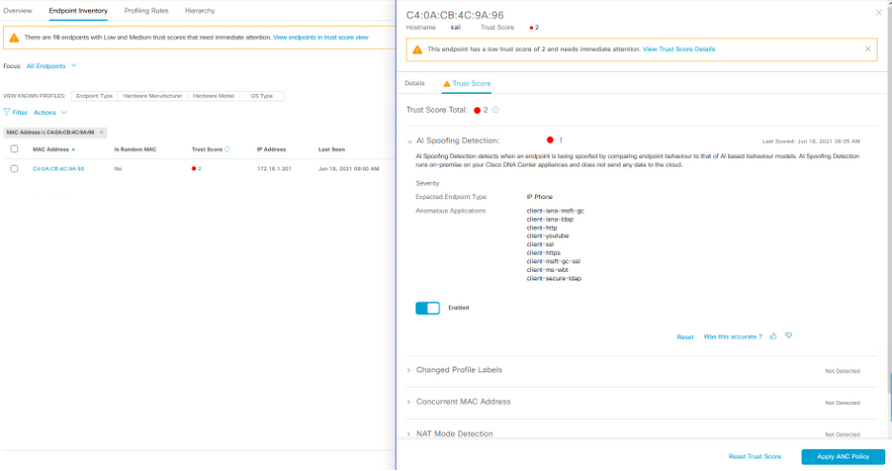
When an endpoint exhibits anomalous behavior while impersonating a legitimate endpoint, you can click on the endpoint from the overview screen, from the Trust Score dashlet, click on endpoints that has low/medium scores that takes you to the Endpoint inventory screen below.
You will see the endpoint entry with Trust Score view. Remember you will only see the endpoints that has a Trust Score associated.
On the top left, you can see the Focus: All Endpoints drop down that helps you toggle from Trust Score to All Endpoints to change the view.
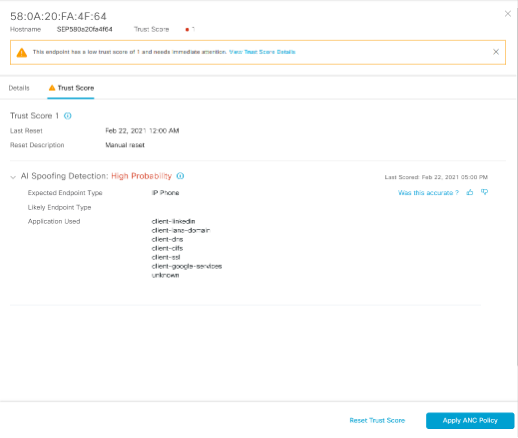
Click on the endpoint MAC address to open the side panel, click on Trust Score tab in the side panel to gather details on why you are seeing the issue.
Trust Score view. will only show endpoints that has Trust Score associated. If the endpoint is in the database for a while and not purged and is not seen connecting again, it will not show in the Trust Score view.
The Endpoint inventory side panel screen helps you take action caused by the anomaly/threat.
Click on the endpoint of interest to observe the details on the right side panel and take appropriate action based on alert shown. You can also take action to change the access policy of the endpoint by clicking on the ‘Apply ANC Policy’ button in the bottom of the side panel shown below.
Rapid Threat Containment
Adding ANC policy for AI spoof detection
This is a mechanism that allows Cisco DNA Center and other products to contain the threat by swiftly acting on the infrastructure to block or quarantine the endpoints. If an admin finds that there is an anomaly, he or she can use ISE Adaptive Network Control (ANC) Policy to block or limit access to the bad actor endpoint.
When Security/IT admin finds an anomaly with a low or medium Trustscore, you can Apply ANC policy from DNA Center directly that allows action on the switchports connected to the endpoint to shutdown (or) terminate connection/reauthenticate (e.g. update SGT) etc. If you chose to shutdown the port, this action is carried out by ISE on the network. ISE uses Adaptive Network Control policy which is a mechanism to accept and take action from external systems, that are integrated via pxGrid, such as DNA Center/Stealthwatch or Firepower. ISE then sends a CoA to perform the action on the switchport connected to the endpoint.
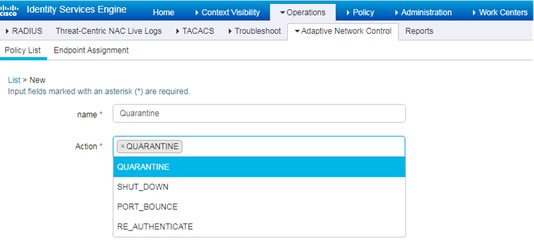
The first step for this is to create the ANC policy in ISE.
ANC service gets enabled by default when pxGrid is enabled. You can disable it manually from admin portal only if needed.
You need to set up this policy for different anomaly testing for EFT. Here is a procedure.
Login to ISE UI, go to Operations > Adaptive Network Control. This allows you to create a policy that will allow ISE to Quarantine, Port-Bounce, Re-authenticate or Shutdown the ports connected to the endpoints.
1. Create a policy for each of the action you want to use to isolate the endpoint.
2. You can apply ANC Policy by clicking on Apply ANC policy button in the Endpoint inventory, Endpoint details and TrustScore side panel.
3. Once applied, you can also “Remove ANC Policy” from DNAC by clicking on the relevant button from the screen.
4. The 'Trust Score' It also allows you to provide a feedback by clicking on the Thumbs up/down icon and Reset the Trust score once you complete your investigation on the anomaly.
For DNAC v 2.1.x you will see the following Endpoint inventory screen.
When you click on ‘Endpoint Inventory’ tab on top of the screen above, you can see a list of Endpoints in the inventory.
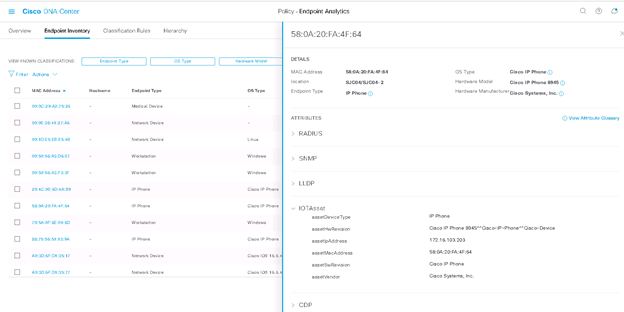
To look at Endpoint details. Click on the MAC address under ‘Endpoint inventory’ tab. A UI side panel opens up from the right. It shows list of protocols and attributes collected. You can also see the type ‘IOTAsset’ attributes that are populated by Endpoint Analytics. These attribute/values will be sent to ISE. Do not close this browser.
Adding Custom Profiling policy in ISE
Warning: When enabled, this will change the profile of all the endpoints that matches causing massive reprofiling in ISE deployment. Avoid doing this in a production ISE system. Create custom policy in ISE with care per device and/or use Network Device Groups as outlined below.
Login to ISE UI on a different browser tab.
The following procedure is applicable if you have pre ISE 3.1 or Cisco DNAC 2.2.3.
- Go to Context visibility > Endpoint Classification view. You will see a list of endpoints in the bottom.
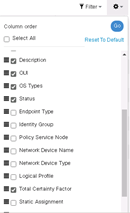
- Click the right top corner on the <gear icon> . It opens the list of columns that can be added in the view. Check the Total Certainty Factor option. This the total weight of the Endpoint profile on ISE.
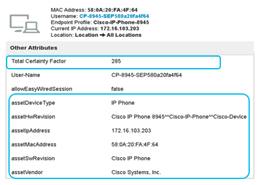
Make note of a few endpoints that needs to be classified by Endpoint Analytics along with ’Total Certainty Factor’ as shown in example below. Let us focus on one endpoint with MAC address “58:0A:20:FA:4F:84”. The total certainty factor is 285.
- Click on the MAC address to open Endpoint details.
- Go to Attributes tab and locate the IOT attributes associated with that Endpoint as in the screenshot below.
Here is a list as in the table below that will match what you saw in Endpoint Analytics UI screen under “IOTAsset”. Also make note of the “Calling station ID”.
| Calling-Station-ID | 58-0A-20-FA-4F-64 |
| assetDeviceType | IP Phone |
| assetHwRevision | Cisco IP Phone 8945^^Cisco-IP-Phone^^Cisco-Device |
| assetIpAddress | 172.16.103.203 |
| assetMacAddress | 58:0A:20:FA:4F:64 |
| assetSwRevision | Cisco IP Phone |
| assetVendor | Cisco Systems, Inc. |
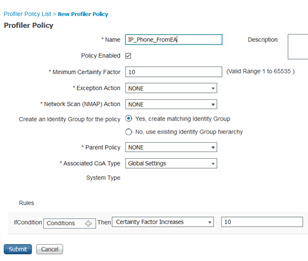
- From ISE UI, go to Workcenter > Profiling > Profiling policies. Add a new custom profiling policy. Use “IP_Phone_FromEA” as the name of the policy.
- Before doing any changes “uncheck” the policy enabled checkbox from the list of options. In the bottom, from Rules, add a new rule below by clicking <gear icon> drop down to the right of screen.
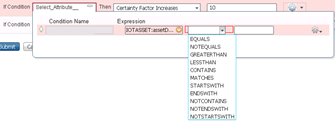
- Once you create a new rule, click on the + in the condition box( Select_Attribute…). Click on create a new condition button. Then Select the attribute as below. Choose “IOTAsset” folder and for e.g.: assetDeviceType attribute. In the center box choose the operator “CONTAINS”.
- This creates a condition and once you select the attribute and the operator, in the third box you must type in the value for the chosen attribute. You can get this from DNAC >AI Endpoint Analytics UI browser tab and capturing the value of attributes under IOTAsset and paste it here.
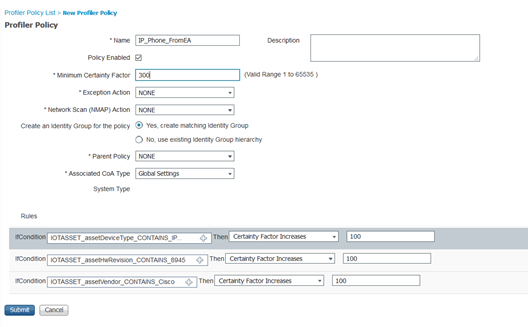
- Add more conditions based on “assetVendor”, “assetHwRevision” and “assetDeviceType” attributes etc.
Note: Last but most importantly add a condition with “AssetMACAddress” and use that. If you do not use this, the profile will match all endpoints based on the conditions added. It is very important to include “AssetMACAddress”.
If you are running in a “production ISE” environment you have to add all the conditions, most importantly the condition to check the MAC address before enabling this. You can also add “Calling-station-ID” which is a RADIUS attribute and use MAC address for the value.
Finally enable, two key things are “Minimum certainty factor” on the top and “Policy enabled” option before saving the policy.
The minimum certainty factor of a custom profiling policy we just created is the aggregation of certainty factor of the conditions below.
Importantly the Minimum certainty factor has to be greater than the Total Certainty Factor we saw above for the endpoint in ISE (Context Visibility > Endpoint Classification).
In our case let us make it 300 which is greater than 285. If you are unsure you can have a number like 500 or 1000.
Last step is to create authorization policy and add the custom profile created above.
Note: If you are using Cisco DNAC 2.2.3 and Cisco ISE 3.1, when you create an authorization policy in ISE you will see the Endpoint Analytics option and you can select the attribute and value based on the Endpoint details screen or from the ISE endpoint details screen.
Before that, you need to consider the level of access you need for different type of devices before and after profiling. Here are some best practices.
Policy and Segmentation tips and best practices
Here are the guidelines on security policy for IOT devices, while creating authorization policies pre and post authentication and profiling.
Designing Security policies:
While designing security policies, for NBAR to do Deep Packet Inspection(DPI), remember that it needs to see the application traffic to profile endpoints correctly. So, default ACL should allow application traffic before authentication and after authentication. Here are some recommendations for different type of endpoints.
If you start with limited access or closed mode, use MAC allowed list (or) Register the devices in the Endpoint Analytics UI that creates labels, use these attributes to create custom profile policy in ISE. You can also create Endpoint ID Groups in Cisco ISE and use it for MAC allowed list. Idea is to give more privileges as you know more context. Having that said, there are two types of devices, Critical Infrastructure/Medical IOT devices and IT managed device. Here are few best practices for these.
Critical infrastructure/Medical IOT devices:
Medical IOT should be in its own VN. You can use SGT’s to allow/prevent access between Medical IOT device once it is profiled.
Medical IOT devices may need continuous access for critical patient care. Even if the other Edge switches are down you need continuous access to its resources with fail open. You can add more access restrictions after profiling as needed after testing and observation(monitor mode). Access restrictions should be based on the type of Medical IOT device.
Example 1: MRI machine may need access to PACs server or a Gateway. MRI machine does not need internet access or to other MRI machines. A PAC server should allow access from a Gateway/MRI machine and Doctor’s workstation.
PACs(Picture Archiving and Communications system) is used for image storage and retrieval and use protocols such as DICOM and HL7 to communicate to outside world.
If in doubt, err towards more access not less access when dealing with Critical IOT for infrastructure or Medical IOT for patient care. Availability is very critical for Medical IOT devices.
IT devices:
For IT devices, it can be part of Campus VN and you can use SGT’s to control access between each other. The same approach mentioned above holds good. Alternatively, you can provide limited access if we know the level of access and applications used by IT. For example: printers, scanners, employee mobile devices or BYOD(Bring Your Own Device). Typically, access to DHCP, DNS, AD, print servers and applications are necessary for continuous access to services can be allowed before authentication. More access can be provided at the end of profiling based on SGT(Scalable Group Tags).
E.g.: Printers may need access to Print server and may be to a specific website to download drivers. BYOD may not need access to internal resources.
If you are working with Enterprise IOT devices(Roku, Apple TV etc) that works based multicast or other applications, remember to open those ports and protocols for NBAR to understand the application and identify the endpoints as default access before authentication.
Based on the role, location, and context of the device, you can provide granular access to the device.
Finally, use the ACL and/or SGT in combination with VN in Authorization policy to provide the right level of access.
Creating Authorization policy in ISE with Custom Profiles
Final step is to use this Profiling policy in Authorization policy to provide the right level of access.
- From ISE UI, go to Administration > Network Resources > Network Device Groups. Create a new Network Devices Group with parent “All Device Types” for the test network device you are adding.
- From Administration > Network Resources > Network Devices, add a new network device with IP/Subnet mask, check the RADIUS settings. Make sure the shared secret is the same in ISE and Network device. Select the Network Device Group just created from the Device Type drop down.
- Go to Work Centers > Network Access > Policy Elements > Results. You will see options in the left panel for Authorization profile. Create a new Authorization profile with VLAN/Downloadable ACL or Scalable Group Tags.
Note: There are default Authorization profiles already available in ISE. When using default Authorization profile, open it to make sure you assign the right ACL in the Authorization profile. The assignment of VLAN/ACL or SGT can be done under “Common Tasks” inside an Authorization profile.
When assigning SGT, choose the name of the SGT that opens up another drop down to choose the corresponding Virtual Network for SDA deployments. For non-SDA deployments leave this empty.
To create a new Downloadable ACL you can see the corresponding option on the left panel of the screen under Work Centers > Network Access > Policy Elements > Results. Once you create Downloadable ACL, add it to the Authorization profile you created.
- Go to WorkCenter > Profiling > Policy Sets
Now you need to add a new policy set by clicking ⊕. Type in the name of the policy set. Add a condition by clicking + that opens a Condition Studio, select DEVICE from the Dictionary and Device Type as attribute. Select the new Network Device Group we created above, from the drop down.
- Click on the right arrow > (to the right of the Policy set entry) to open the policy set. Click on the authorization policy, to open it and you will see policies already available out of box. You can create new authorization policies on the top to get processed first.
- Following configuration steps is needed to map the endpoint profile policy to an authorization policy.
- Click on ⊕ to add a new authorization policy.
- Highlight the new rule name and type in a new rule name, e.g.: ‘EA IP Phone’
- Click + under conditions, this opens a Condition studio (close the help screen if one pops up).
- In the Editor window, click to add an attribute (close the help screen if one pops up), choose Endpoints Dictionary from Dictionary drop down. Select EndPointPolicy attribute.
- In the ‘Choose from list or type’ box, choose the Profiling policy you created above for the IP Phone as the value (IP_Phone_FromEA). Click Use.
- This brings you back to the Authorization policy screen.
- For the Authorization policy you created, under the Results > Profiles column. Click on select from list and choose a “Cisco_IP_Phone”.
- Scroll down and Save it.
- Add the Scalable Group Tag in the Results of the Authorization policy. Save it.
Troubleshooting tips
- Check if pxGrid is turned on
- Check if the following setup is done to get the PxGrid on1k
Appendix 1: Cisco Traffic Telemetry Appliance bootstrapping
- Configure the Telemetry Box authentication. (Use this for pre-configuring the box for on-boarding)
Hostname telemetry-box
enable password lab
aaa new-model
aaa authentication login default local
username admin privilege 15 password 0 cisco
enable password <xyx1123!!>
- Configure UTC time. Example:
ntp server 2.2.2.2 source GigabitEthernet0/0/5
or
clock set 18:00:00 1 Jan 2019
- Configure the Cisco NBAR configuration for Control and Provisioning of Wireless Access Points protocol
(CAPWAP) traffic. Example:
ip nbar classification tunneled-traffic capwap
ip nbar classification granularity fine-grain
- Configure Management interface to send Telemetry data to DNAC
interface GigabitEthernet0/0/5
description ***** Management port to talk to DNAC ********
ip address <Management IP address of appliance> <Subnet mask>
- Configure the default route. Example:
ip route 0.0.0.0 0.0.0.0 <Gateway IP address>
- Configure the DNS server. Example:
ip name-server <IP address of DNS server>
- Cisco Traffic Telemetry appliance port initial port configuration before managed by DNAC.
Example:
Configure Telemetry Box Network Settings
int Te0/0
description ****** Ten Gig SPAN ****

int Te0/1
description ****Ten Gig SPAN from second distribution***

interface GigabitEthernet0/0/0
description ***** Span Traffic ********

interface GigabitEthernet0/0/1
description ***** Span Traffic ********

interface GigabitEthernet0/0/2
description ***** Span Traffic ********

interface GigabitEthernet0/0/3
description ***** Span Traffic ********

interface GigabitEthernet0/0/4
description ***** Span traffic ********

interface GigabitEthernet0/0/5
description ***** Management port to talk to DNAC ********
ip address <x.x.x.x> <y.y.y.0>

int gi0
description ***Port used as a backup Management for Router***
Appendix 2: ML data collection configuration checklist
- Verify presence of DNAC packages (without them you won’t see anything of the things you show afterwards)
AI Endpoint Analytics, Application Visibility Service, AI Network Analytics.
- NetFlow configuration:
- Enable NetFlow under network design, telemetry, pointing to DNAC or to an external netflow collector (Stealthwatch UDP director)
- In case of pre-existing config (e.g. netflow configuration for Stealthwatch) the config may need to be manually pushed/reviewed.
- Verify the correct flow monitor is assigned to each of the access ports.
- ISE config (as in the document)
- Add to check the profiler config for Probe Endpoint Data export / pxGrid as profiler probe source
- Verify network devices in DNAC inventory (This should be the same network device between DNAC and ISE, use the NAS (Network Access Server) IP address to add to DNAC inventory.
- Verify ISE integration in DNAC (on System 360) and pxGrid turned on.
- Verify if endpoints authenticated by ISE (either with dot1x or MAB).
- ISE profiler config (as in the document)
- Devices are CBAR ready and provisioned (as in the document)
- NetFlow config (provisioning from DNAC, record template details, verify on the device, check the pre-existing config and add/change the flow records based on the configuration provided)
- Check if Endpoints shows up in Assurance in Client 360 and Endpoint Analytics UI.
- Confirm logical class (Verify in EA if the MAC address corresponds to IP Phone/Printer and is having the Endpoint Type label).
Glossary:
EA: Cisco AI Endpoint Analytics: An application running on Cisco DNAC that provides Endpoint visibility and collects asset information from various sources.
DNAC: Cisco DNA Controller: A platform/controller that provides Automation, Assurance and Policy to Enterprise in managing their network.
ISE: Identity Service Engine, a software appliance that provides AAA services, verifies compliance and enforces network access and access control policies.
pxGrid: Platform Exchange Grid Service that exchanges endpoint information between ISE and other Cisco and non-Cisco products.
AAA: Authentication, Authorization and Accounting, that refers to how endpoints and users are authenticated and authorized in the network typically using RADIUS protocol.
SDAVC: Software Defined Application Visibility Control is a service that runs on Cisco DNA Center that gathers application and endpoint information from network used for application recognition and endpoint visibility.
NBAR: Network Based Application Recognition is the sensor engine embedded in the network device that does deep packet inspection of Layer 7 protocols as well as information from Layer 3 and Layer 4 for detecting applications and endpoints in the network.
CBAR: Controller Based Application Recognition is the controller side component in DNAC that enables NBAR in network device.
SPAN: Refers to a connection where a copy of L2 traffic is mirrored from one or more VLANs, ports to a destination.
AI: Artificial Intelligence refers to use of the AI service on DNAC and in the cloud to provide intelligence for endpoint analytics along with crowdsourcing.
ML: Machine Learning refers to algorithm/s used for clustering unknown endpoints for admins to label them that can be used for crowdsourcing.
IOT: Internet of Things are endpoints in an enterprise that has specific purpose and not general purpose endpoints(mobile devices, laptops, printers etc.).
DNS: Domain Name Service, that provides name services to map IP address to a name that is used by applications, products, services to reach a certain destination.(e.g.: Email service, application service, servers, endpoints)
Find answers to your questions by entering keywords or phrases in the Search bar above. New here? Use these resources to familiarize yourself with the community:
