- Cisco Community
- Technology and Support
- Security
- Security Knowledge Base
- RADIUS Load Balancing for ISE
- Subscribe to RSS Feed
- Mark as New
- Mark as Read
- Bookmark
- Subscribe
- Printer Friendly Page
- Report Inappropriate Content
- Subscribe to RSS Feed
- Mark as New
- Mark as Read
- Bookmark
- Subscribe
- Printer Friendly Page
- Report Inappropriate Content
07-06-2023 11:14 AM - edited 02-21-2024 05:04 PM
As more and more companies adopt a mandate to move services to cloud, we have seen the number of requests rising for Cloud Based Load Balancers for RADIUS traffic. In this guide, I will detail the load balancers that I have configured and show how to set them up to work with ISE.
The information in this guide was covered in the Cloud Load Balancers with ISE Webinar.
I'll be covering the following load balancers in this document, select the one that you're interested in to jump to that section.
- Load Balancer Concepts
- Proxy Servers
- Reverse Proxy Servers
- Backend Servers
- Backend Pools
- Listeners
- Virtual IPs (VIPs)
- Load Balancing Methods
- Session Persistence
- Load Balancing Distribution Algorithms
- Health Checks
- Source NAT (SNAT)
- Public Cloud Native Load Balancers
- AWS Native:
- Backend Server Pools
- Backend Servers
- Session Persistence
- Network Load Balancer
- Listeners
- Azure Native:
- Install Network Load Balancer
- Which Load Balancer Do I Choose?
- Virtual IPs
- Backend Pools
- Listeners, Health Checks, and Session Persistence
- Resources
- Azure Cloud Cost Estimator
- Azure Cloud Free Tier Access
- Load Balancer SKUs Comparison
- Oracle Cloud Infrastructure (OCI) Native:
- Install Flexible Network Load Balancer
- Listeners
- Backend Pools, Health Checks, and Session Persistence
- Resources
- OCI Cost Estimator
- OCI Free Tier Access
- Open Source Load Balancers
- NGINX Plus
- Install NGINX Plus
- Configure NGINX Plus
- Resources
- Traefik proxy open source
- Why I chose Traefik to run in OCI
- Install an Ubuntu instance in OCI
- Configure Ubuntu for multiple IP addresses
- Install Traefik
- Configure Traefik
- Traefik configuration basics
- Traefik configuration files
- Configure logging
- Setup Service
- Run Traefik
- Configure Traefik for Prometheus
- Add Traefik as a Data source for Infrastructure Monitoring in ISE
- Add a new dashboard for Traefik in ISE
- Configure Traefik for ElasticSearch
- Cisco Catalyst RADIUS Load Balancing
- Health Checks
- Backend Servers
- Backend Pool and Load Balance Method
- Session Persistence
- Testing the Load Balancers
- RADTest
- Script
- Verify Load Balancer Function in ISE
- Resources
Load Balancer Concepts
Proxy Servers
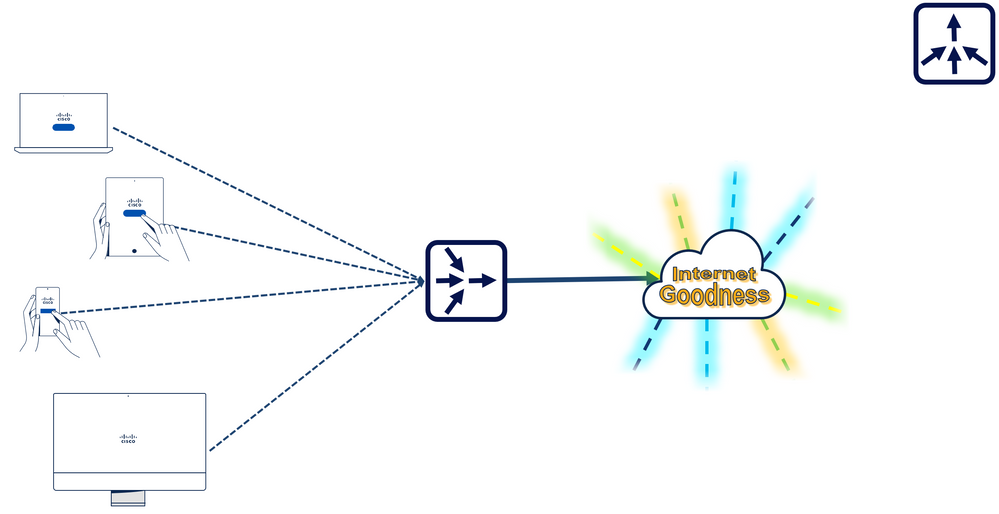
Before we jump into the specifics of the load balancers, there are some basics that everyone should know to help ensure you use the configuration that is right for your organization. First, most administrators looking into Load Balancers already understand the concept of a proxy server. Simply put, using a proxy server in your organization will funnel all traffic destined for the Internet through the proxy to ensure certain rules and conditions are met. Notice that the network symbol for the proxy server is multiple arrows converging into one.
Reverse Proxy Servers
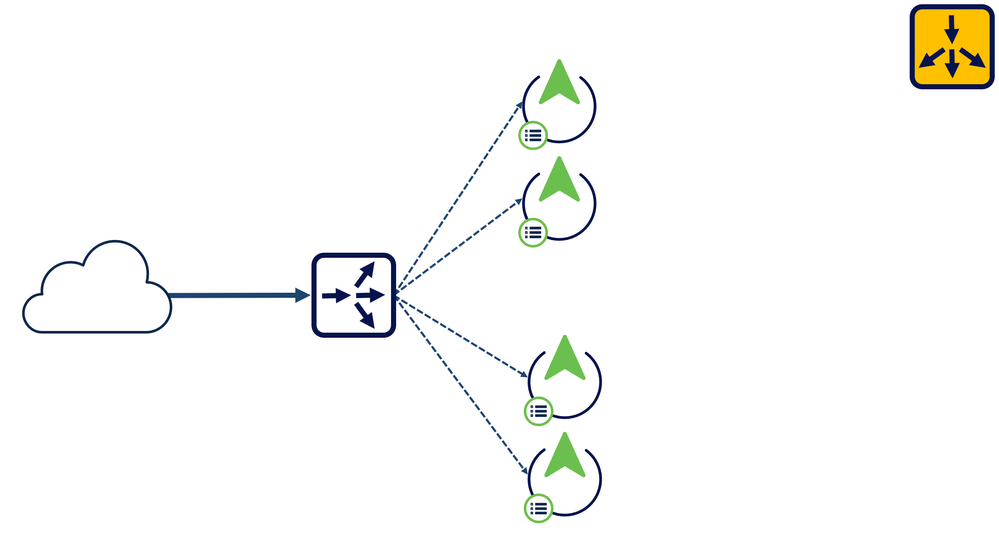
Load Balancers are often referred to as Reverse Proxy servers. This is due to the fact that traffic is sent to a specific address and from there is sent to "backend servers" in such a way that none of them are overwhelmed. This is especially helpful in high traffic environments where a lot of requests are sent to your servers. As you can see, the network symbol for a load balancer is a single arrow splitting into multiple arrows, the exact reverse of the symbol for a proxy server.
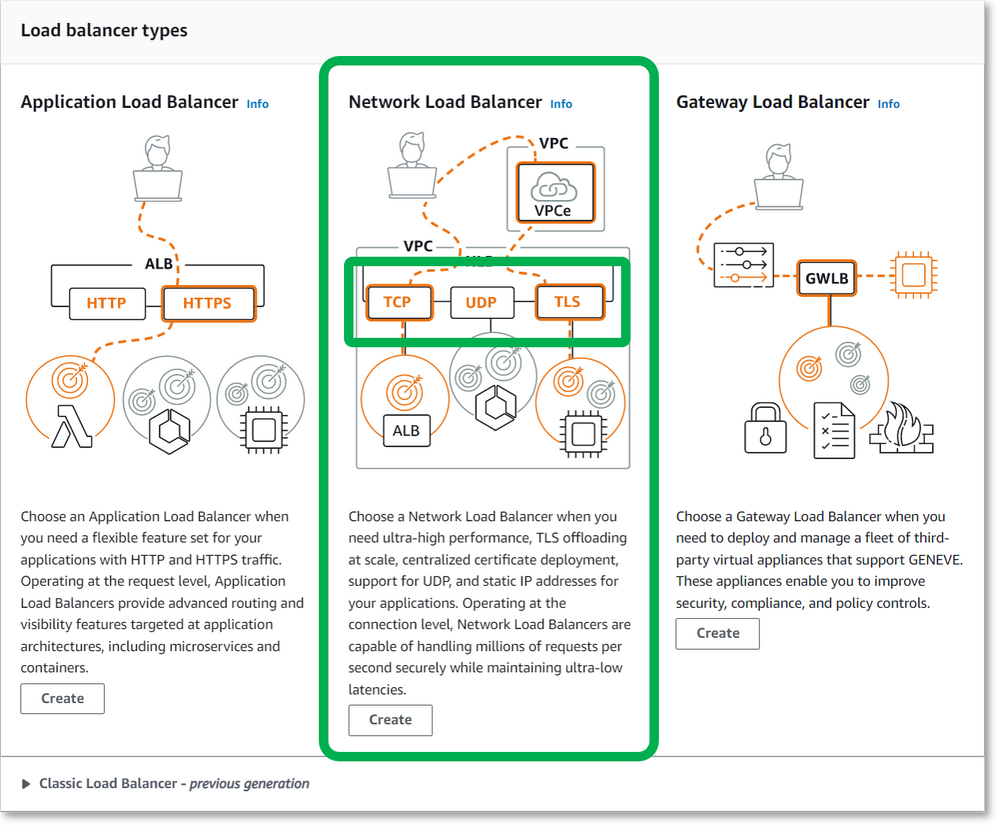
A major consideration for choosing your load balancer is the ability to handle UDP traffic. Since RADIUS authentication, authorization, and accounting packets are UDP, this is a critical need. Application Load Balancers do not process UDP packets and are generally not a good choice for RADIUS environments. Network Load Balancers are typically what you want to look for, but make certain that the one you choose processes UDP. All of the load balancers detailed in this article will process UDP packets.
Backend Servers
Referring to the network symbol for the load balancer again, the multiple arrows that are split from the single arrow are pointing to the servers that will service the requests that have been sent. In our case, these are the ISE Policy Service Nodes (PSNs). These servers are referred to as the Backend Servers. This is because the request is sent to the IP address assigned to the load balancer (the front end, since this is the address that is seen by the clients) and the request is serviced "behind the scenes" or in the Backend.
Backend Pools
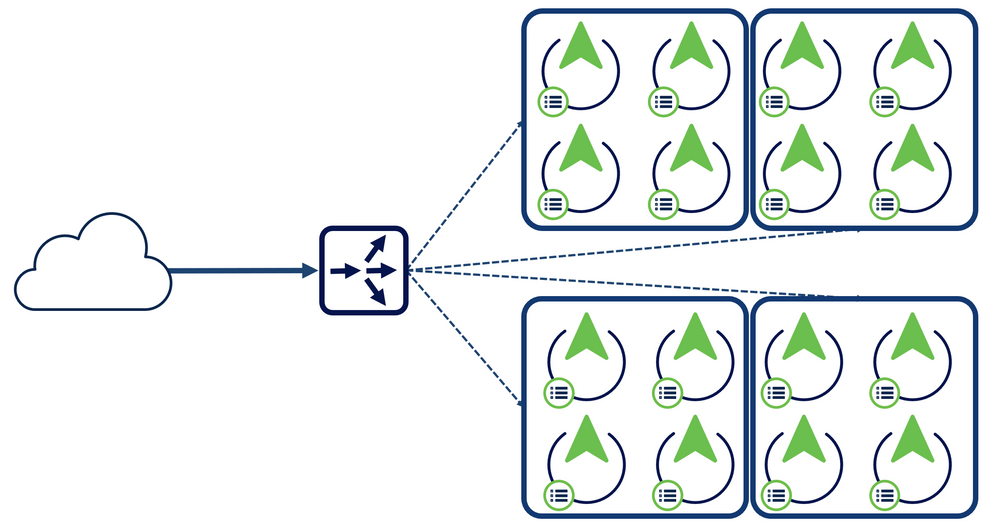
A backend pool is a group of backend servers that share the same incoming interface on the Load Balancer. This is the group that will share the requests from the load balancer.
Typically you would want to group your PSNs into the same backend pool(s) based on geographical region, the same way you would for Node Groups in ISE. A good rule of thumb is to use your node groups as a basis for your backend pools, this way, the session information is shared between the PSNs in a specific backend pool.
Listeners
A Listener is how you tell the load balancer to "route" the requests. This is your Frontend. These listeners are the ports for which the load balancer will "listen" and forward on the the backend servers. When talking about RADIUS requests for ISE, our listeners are going to be udp1812 and udp1813. If load balancing TACACS+ traffic, you need a listener for tcp49.
If your load balancer IP address is 192.168.100.100, then any UDP request sent to 192.168.100.100:1812 will be sent to the backend pool assigned to the udp1812 listener. Any traffic sent to the Load Balancer that does not have a listener configured will be dropped.
Virtual IPs (VIPs)
Depending on the size of the environment or the geographic distance of your nodes, you may need more than one IP address for your load balancer to configure listeners. For the Cloud Native Load Balancers, this means that you would need to "spin up" additional load balancers and assign the backend pools to the load balancers that are in the same Availability Zone(s) as your PSNs.
For other load balancers, you can create additional IP addresses and/or network interfaces on the load balancers. These additional IP addresses (whether assigned to the same interface or to additional interfaces) are referred to as Virtual IPs (vips). In these cases, your listeners will be configured using those virtual IPs, such as: 192.168.105:1812 udp, 192.168.106:1812 udp, etc.. We'll dive deeper into vips in the NGINX Plus and Traefik proxy open source sections of this guide.
Load Balancing Methods
There are a number of Load Balancing methods that are used and this section will help in your decision-making on which to use in your environment. Remember that UDP is a connectionless protocol, so any method that relies on a connection should not be used.
|
Method |
Description |
Useful for RADIUS |
|---|---|---|
| Round Robin | Distributes packets evenly to backend servers | ☑ |
| Weighted Round Robin | Distributes packets evenly to backend servers considering their assigned "weight". A server with a weight of 3 will process 3 times as many requests as a server with a weight of 1. This is especially useful in environments where both an SNS-3715 and an SNS-3755 are used as PSNs in the same backend pool | ☑ |
| Hash | A 5-tuple hash using the Source IP and Port, Destination IP and Port, and Protocol to distribute the packets (see Load Balancing Distribution Algorithms) | ☑ |
| Least # of connections | Distributes packets evenly to the backend servers, prioritizing those servers with the least # of current connections | ✘ |
| Least time to connect | Distributes packets evenly to the backend servers, prioritizing those servers with the least amount of time to create a connection | ✘ |
| Least time to receive response | Distributes packets evenly to the backend servers, prioritizing those servers with the least amount of time to receive a response | ☑ |
| Random | Randomly chooses 2 backend servers and then chooses the one with the least # of connections or least time to receive a response. This method is used for distributed environments where multiple load balancers are passing requests to the same set of backends | ☑ |
Session Persistence
Session persistence - also known as session affinity or session stickiness - ensures that all packets from a client device will be sent to the same backend server. This is especially important with RADIUS sessions to allow the PSN to properly manage the lifecycle of a user/device session. ISE requires that RADIUS authentication and authorization traffic for a given session be established to a single PSN. This includes additional RADIUS transactions that may occur during the initial connection phase such as reauthentication following CoA.
It is advantageous for this persistence to continue after initial session establishment to allow reauthentications to leverage EAP Session Resume and Fast Reconnect cache on the PSN. Database replication due to profiling is also optimized by reducing the number of PSN ownership changes for a given endpoint.
RADIUS accounting for a given session should also be sent to the same PSN for proper session maintenance, cleanup and resource optimization. Therefore, it is critical that persistence be configured to ensure RADIUS authentication, authorization, and accounting traffic for a given endpoint session be load balanced to the same PSN.
See the next section, Load Balancing Distribution Algorithms, for details on Session Persistence and how its used in the distribution of packets.
Load Balancing Distribution Algorithms
|
Distribution Mode |
Hash Based |
Session Persistence: Client IP |
Session Persistence: Client IP and Protocol |
|---|---|---|---|
| Overview | Traffic from the same client IP routed to any healthy instance in the backend pool | Traffic from the same client IP routed to any healthy instance in the backend pool | Traffic from the same client IP and protocol is routed to the same backend instance |
| Tuples | 5 tuple | 2 tuple | 3 tuple |
| Information per tuple | Source IP, Source Port, Dest IP, Dest Port, Protocol | Source IP, Source Port | Source IP, Source Port, Protocol |
| Azure Configuration | Session persistence: None | Session persistence: Client IP | Session persistence: Client IP and protocol |
| AWS Configuration | No stickiness | Stickiness | N/A |
| OCI Configuration | Load balancing policy: 5-tuple hash | Load balancing policy: 2-tuple hash | Load balancing policy: 3-tuple hash |
Health Checks
Health Checks keep monitoring the health of servers. If a server is unresponsive or returns errors, the server is marked dead and is removed from the load balancer rotation pool. If a server has recovered and returns proper responses, it will be added back to the load balancer rotation pool.
The configuration and options for configuration of Health Checks vary from load balancer to load balancer.
Source NAT (SNAT)
RADIUS Change of Authorization (CoA) is used to allow the RADIUS server to trigger a policy server action including reauthentication, termination, or updated authorization against an active session. In an ISE deployment, CoA is initiated by the PSN and sent to the NAD to which the authenticated user/device is connected. The NAD IP address is determined by the source IP address of RADIUS authentication requests, a field in the IP packet header, not a RADIUS attribute such as NAS-IP-Address.
RADIUS CoA traffic initiated by the PSNs can be set as originating from the vip of the load balancer (in some load balancers). In this case, one would only need to configure the vip of the load balancer as the CoA server in their Network Access Device (NAD), for example, a Catalyst switch:
aaa server radius dynamic-author
client 192.168.100.105 server-key cisco123
⚠
NOTE: CoA traffic from NADs to the PSN should NOT use Source NAT. SNAT of NAD-initiated RADIUS AAA traffic will break CoA operation
None of the Load Balancers in this guide use Source NAT, which means that each access device must be individually configured with the unique IP address of every PSN in the backend group. Some of the issues that could arise due to this are:
- What if new PSNs are added?
- What if existing PSNs must be readdressed or removed?
- Some access devices like the WLC or Meraki are limited by the number of RADIUS Server entries thus making it difficult to configure trust for a large number of possible PSN servers.
- The management of these entries can be problematic and become out of sync.
So for large deployments or those deployments with more backend servers than can be configured in your NADs to handle CoA (Meraki is limited to 3 RADIUS servers), you'll want to find anothr Load Balancer, such as F5 or A10.
Public Cloud Native Load Balancers
Since ISE is supported in AWS, Azure Cloud, and OCI, these are the Public Cloud Native Load Balancers that will be the focus of this guide. They all have their similarities and differences, so I created this table to help break them down.
|
AWS |
Azure |
OCI |
|
|---|---|---|---|
| Name | Network Load Balancer (Internal) | Load balancer (Standard) | Flexible Network Load Balancer |
| Load Balancing Method(s) | Hash | Hash | Round Robin, Weighted Round Robin |
| Listener Types | Per Port for TCP, UDP, TCP_UDP, TLS | Per Port, All Ports (HA ports) | Per Port, All Ports, UDP only, TCP only, UDP/TCP, UDP/TCP/ICMP |
| Session Persistence | Client IP | Client IP, Client IP & protocol | Client IP and port |
| Health Monitor | HTTP/HTTPS/TCP | HTTP/HTTPS/TCP | HTTP/HTTPS/TCP/UDP |
| Origin Server Target | Instances, IP address | NIC, IP address | Compute Instance, IP address |
| Cost (LB + Bandwidth) | $0.0225/hr + $0.006/NLCU hr | $0.025/hr + $0.005/GB | Always Free + $0.0001/hr |
| Pricing Tool |
aws.amazon.com/elasticloadbalancing/pricing
|
azure.microsoft.com/en-us/pricing/details/load-balancer/
|
www.oracle.com/cloud/costestimator.html |
AWS Native:
Elastic Network Load Balancer
This section will detail how to set up a Load Balancer in AWS for ISE RADIUS traffic.
First log in to your AWS account. Now, I know that a load balancer, especially a Network Load Balancer, just makes sense to be found in the network section of you cloud provider, but instead of finding these settings in the VPC dashboard of your AWS account, the Load Balancers are actually found in the EC2 dashboard. So either search for or navigate to your EC2 dashboard and scroll down to the Load Balancing menu.
Backend Server Pools
The first step to setting up an AWS Load Balancer is to set up you backend server pools. In AWS, these are called Target Groups. Select the Target Groups menu under Load Balancing. At the top right of this table, select the Create target group button.
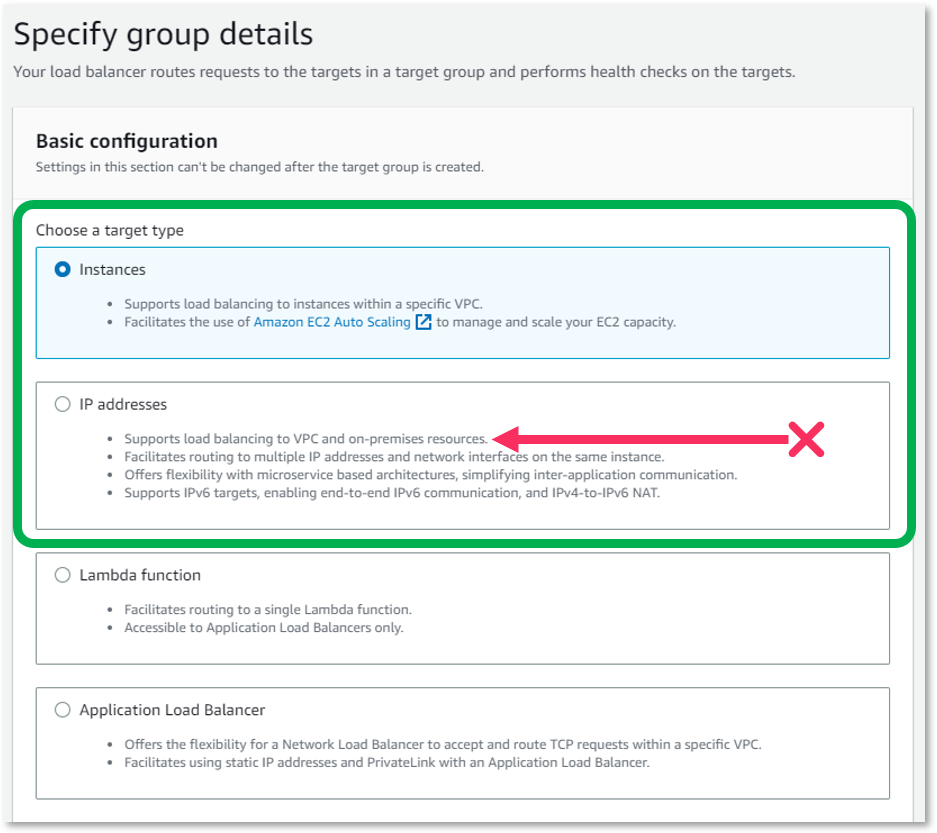
As you read the target type details, you'll notice that the IP addresses target type states that is supports load balancing to VPC and on-premises resources and this will be enough to tempt you to choose this option. The truth is, however, that load balancing between VPC and on-premise is not supported for UDP.
Of the four choices, you can choose Instances or IP addresses, though Instances is recommended. Neither the Lambda function nor the Application load balancer is supported for UDP.
Then give your Target Group a name. Choose the port for which you want to create this Target Group. You will need a separate Target Group for 1812 and 1813. Remember to change the Protocol to UDP for each of these Groups. Then select the VPC that contains the PSNs for this Target Group.
You MUST set up a health check for each Target Group, and since AWS supports only HTTP or HTTPS for these checks (and these checks are a simple ping), I like to use HTTPS and I expand the Advanced health check settings to set an override port of 443 for the checks. You can set the thresholds, timeout, and interval from this screen, too. I've used the defaults, you might want to adjust these in a higher traffic environment.
You cannot adjust the attributes for the Target Group until you save so select Next to move to the next step.
Backend Servers
Select the Instances that you want to register to the Target Group and select the Include as pending below button. Select the Create target group button. Select your new Target Group. Notice that the Health status shows unused. This is the current state until you add the Target Group to a Load Balancer. Before we do that, select the Attributes tab and then the Edit button.
Session Persistence
On this screen, under the Target selection configuration section, turn on Stickiness to enable session persistence. then Save changes. Do this for each Target Group.
Network Load Balancer
In your EC2 menu, select the Load Balancers item under Load Balancing. Choose the Create load balancer button. On this screen, you MUST choose the Network Load Balancer as it is the only option that allows for UDP load balancing.
Give your load balancer a name and decide whether you want an Internet-facing (NO!) or Internal (YES!) load balancer. Internet-facing is bad. You should not be processing RADIUS requests over the open Internet as this is very insecure. The recommendation is to use a Site-to-Site VPN between your network and your cloud provider.
Choose the VPC for your Load Balancer - this is normally in the same VPC as your Target Groups. Choose the availability zone for your load balancer and then the subnet you'd like to use. You can either allow AWS to assign an IP address to the load balancer via DHCP by leaving the default selection of Assigned from CIDR or manually assign an IP Address from the subnet you chose by selecting Enter IP from CIDR from the dropdown.
Listeners
Under the Listeners and routing section, create the listeners for your Load Balancer. You should create one for each Target Group you'll use for this load balancer. Select the UDP Protocol and Port 1812. In the Default Action dropdown select the Target Group that is assigned 1812. Select the Add listener button and create another listener for 1813.
Select Create load balancer, then View load balancer. The state of your new load balancer will be Provisioning until it is ready to use. Once the status changes to Active, select your load balancer. If you let AWS set the IP address for you, choose the Network mapping tab. As you can see (or in this case not see), the IP address is not listed here. To see what IP address has been assigned to your Load Balancer, choose Network Interfaces under the Network & Security menu in the EC2 dashboard.
If you look at the Description column, you'll see an entry that begins with ELB net/. This is the network interface for your load balancer. Select this interface and at the bottom of the screen, in the details tab, scroll to the IP addresses section and find your IP address in the Private IPv4 address field. Note this address down, this is the address you will configure in your NADs as your RADIUS authentication and RADIUS accounting server.
Azure Native:
Load Balancer
This section will detail how to set up a Load Balancer in Azure Cloud (Azure from here on) for ISE RADIUS traffic.
Install Network Load Balancer
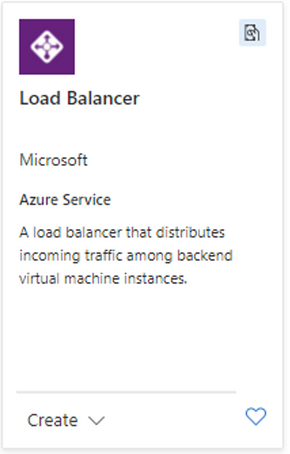
First log in to your Azure account. You can either select Create a resource or the Marketplace icon, either one will allopw you to search for Load Balancer. Select the Load BBalancer from Microsoft as seen here
Once selected, choose Create. This starts the wizard that will walk you through creating your load balancer. On this first step,
- Choose your Resource group or create a new one.
- Give your load balancer a Name
- Select your Region
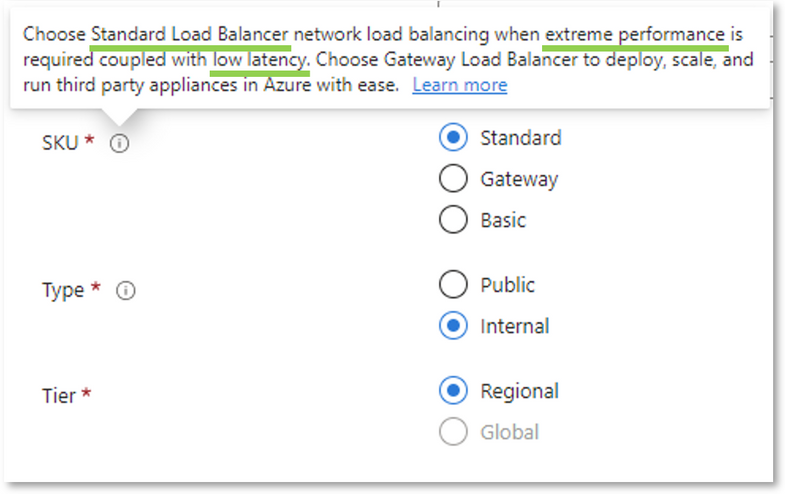
- Choose the load balancer SKU you want to use. (Use the Standard SKU, see the picture and table below for the reason)
- The Type should be internal since Internet-facing ISE is bad. You should not be processing RADIUS requests over the open Internet as this is very insecure. The recommendation is to use a Site-to-Site VPN between your network and your cloud provider.
- The Tier is set to Regional for a Standard, Internal Load Balancer
- Press the Next: Frontend IP configuration > button
Which Load Balancer Do I Choose?
|
Standard |
Basic |
|
|---|---|---|
| Scenario | Equipped for load-balancing network layer traffic when high performance and ultra-low latency is needed. Routes traffic within and across regions, and to availability zones for high resiliency. | Equipped for small-scale applications that don't need high availability or redundancy. Not compatible with availability zones. |
| Backend Type | IP based, NIC based | NIC based |
| Health Probes | TCP, HTTP, HTTPS | TCP, HTTP |
| Availability Zones | Zone-redundant and zonal frontends for inbound and outbound traffic | Not available |
| Diagnostics | Azure Monitor multi-dimensional metrics | Not Supported |
| HA Ports | Available for Internal Load Balancer | Not available |
| Secure by default | Closed to inbound flows unless allowed by a network security group. Internal traffic from the virtual network to the internal load balancer is allowed. | Open by default. Network security group optional. |
For more detailed information of the selection of Load Balancer SKUs, follow this link https://learn.microsoft.com/en-us/azure/load-balancer/skus#skus
Virtual IPs
On this next page,
- Select
+ Add a frontend IP configuration - For this configuration,
- Name the frontend
- Choose the Virtual network
- and the Subnet
- Choose whether you want a static or dynamic IP address fro the load balancer
- Assign the IP address from the subnet you chose
- Select the Add button
- Repeat steps 1 and 2 for as many VIPs you'd like for your load balancer
- Select Next: Backend Pools >
Backend Pools
- Select
+ Add a backend pool - For this configuration,
- Name the backend pool
- Choose whether to address the backend servers via NIC or IP address
- Add your ISE PSNs as backend servers
- Save the configuration
- Repeat steps 1 and 2 for as many backend pools as you'd like for your load balancer
- Select Next: Inbound rules >
Listeners, Health Checks, and Session Persistence
- Select
+ Add a load balancing rule - For this configuration,
- Name the load balancing rule
- Choose the IP Version
- Choose the Frontend IP address you created earlier
- Choose the Backend pool you created earlier
- Enable High availability ports to enable listeners on all TCP and UDP ports for the backend pools
- Select Create new for the Health probe
- Name the Health probe
- Choose the protocol - I use HTTPS
- Set the Port - I use 443
- Set the Path to /admin/login.jsp - this lets me know the
Application Serveris running - Save
- Choose the Session persistence setting for Client IP and protocol
- Save
- Repeat steps 1 and 2 for each Frontend IP configuration and backend pool you created
- DO NOT create an inbound NAT rule. Remember
NAT of NAD-initiated RADIUS AAA traffic will break CoA operation
- Select Next: Outbound rules >
⚠ Outbound rules using Source NAT is disabled when a Public IP address is not in use on your load balancer
Select Next: Tags > and enter the tags you'd like to use for your load balancer deployment, then choose the blue Review + create button. Once you see Validation passed select the blue Create button.
Your load balancer will be created and when finished you will see Your deployment is complete. Now you can add this load balancer in your NADs as the aaa authentication and aaa accounting server.
Resources
Azure Cloud Cost Estimator
Azure Cloud Free Tier Access
Load Balancer SKUs Comparison
Oracle Cloud Infrastructure (OCI) Native:
Flexible Network Load Balancer
This section will detail how to set up a Load Balancer in OCI for ISE RADIUS traffic.
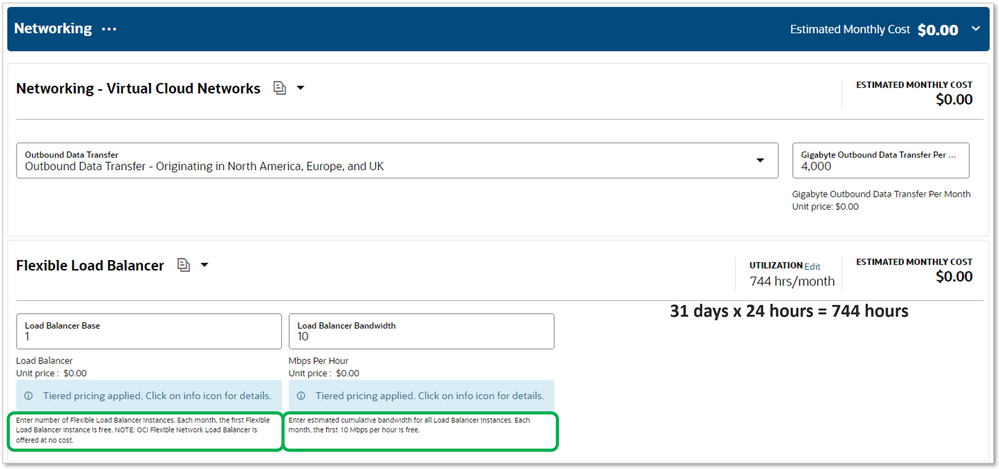
Using the OCI Load Balancer Cost Estimator to verify that I can get an Always Free Network Load Balancer in Oracle Cloud, here's what I hae come up with.
The Always Free Load Balancer is free for 744 hours per month. This calculates to a 31 day month, so far, so goo. Next, pay attention to the green boxes around the fine print. It states "the first Flexible Load Balancer instance is free". but then it also states "NOTE: OCI Flexible Network Load Balancer is offered at no cost." so is this free for as many as I want since I know I want the Network Load Balancer? We'll find out during the selection process. The other box states that "the first 10Mbps perhour is free"., so the bandwidth might bbe the only cost depending on your traffic. Fo me and my lab setup, this means it's a totally FREE load balancer.
Install Flexible Network Load Balancer
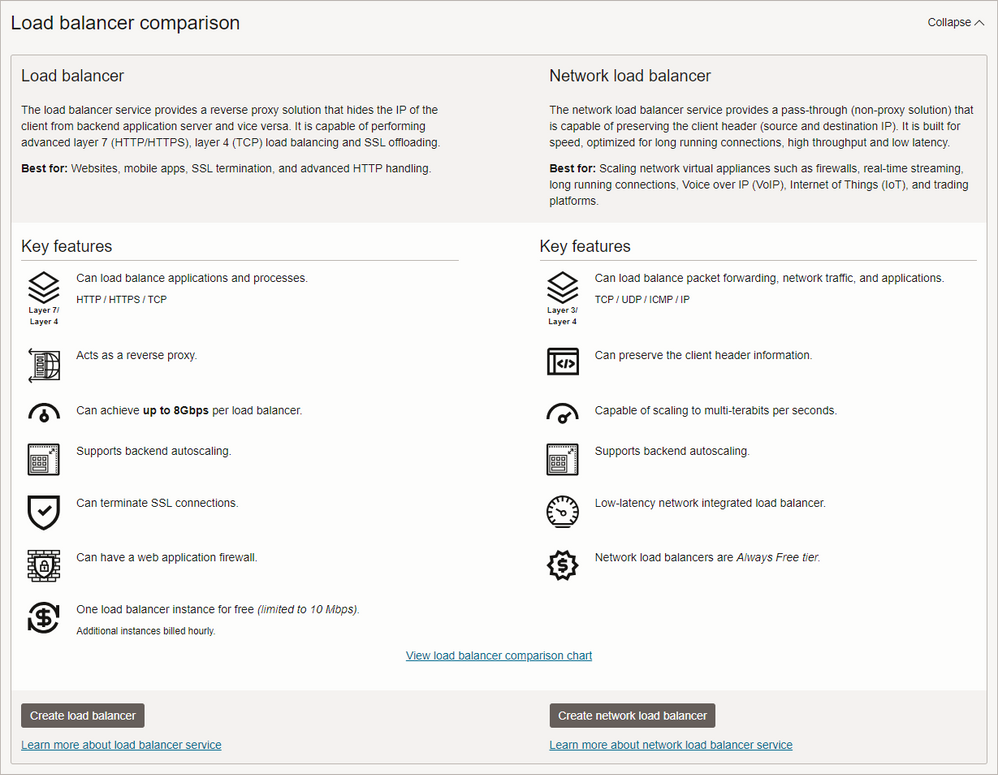
Once logged in to OCI. open the hamburger menu and select Networking > Load Balancers > Overview. You can see from the Load balancer comparison on this page that the Network load balancers are Always Free tier. This means as many as you want!
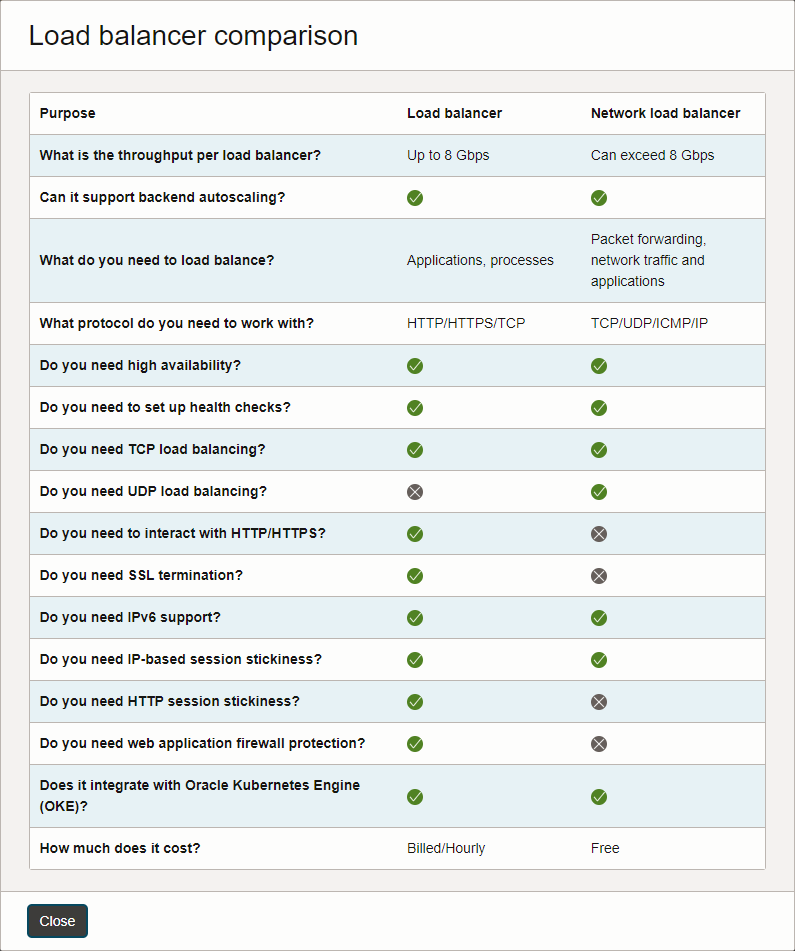
If you activate the View load balancer comparison chart link, you'll see this great chart showing that the Network load balance is not billed at all whereas the Load balancer is billed Hourly. I don't have enough traffic to stress the bandwidth past 10Mbps to see if I would be billed for this, but the chart would lead me to believe that I would not.
Select the Create network load balancer button to get started.
- Create a Load balancer name
- Choose visibility type of Private since Internet-facing ISE is bad. You should not be processing RADIUS requests over the open Internet as this is very insecure. The recommendation is to use a Site-to-Site VPN between your network and your cloud provider.
- In the Choose networking block, set the Virtual cloud network and Subnet. If you Use network security groups to control traffic then enable the checkbox and choose the Network security group.
- Select the Next button
Listeners
- Create a Listener name
- Specify the type of traffic your listener handles as UDP
- The Ingress traffic port should be set to Use any port. This will automatically listen on ports 1812 and 1813 in a single listener
- Select the Next button
Backend Pools, Health Checks, and Session Persistence
- Create a Backend set name
- Unless you NEED to specify your backend servers via IP address, leave the Preserve source/destination header (IP, port) setting disabled. We will use other settings for session persistence. This one has more to do with bidirectional SNAT which is bad for ISE.
- In the Select backends block, select the Add backends button
- Choose the instance (PSN) that you would like to add. If your PSN has more than one IP address, you can select which IP address to use. By default, OCI uses the Weighted Round Robin Load Balancing Method. If all of your servers are to be configured with the same weight, then leave this as 1 for each of them. This will make the Load Balancing Method work as a Round Robin.
- Choose + Another backend button and repeat for as many PSNs as you are adding.
- Select the Add backends button at the bottom of this configuration panel
- Enable the Preserve source IP checkbox
- In the Specify health check policy block, add the following information
- Protocol: HTTPS
- Port: 443
- URL path (URI): /admin/login.jsp (This essentially checks that the
Application Serveris running)
- Select the Show Advanced Options link
- Choose the Load balancing policy tab
- Select the 3-tuple hash policy. This adds session persistence to the load balncer Backend Pool
- Select the Next button
- Review the settings. If everything looks good, activate the Create network load balancer button
The Network Load Balancer will have a status of CREATING just under the LB hexagon. When the status changes to ACTIVE, you can use your Network Load Balancer. Select the Network Load Balancer ion the breadcrumbs at the top of the screen to see the IP address that was assigned.
Now you can add this load balancer in your NADs as the aaa authentication and aaa accounting server.
Resources
OCI Cost Estimator
OCI Free Tier Access
Open Source Load Balancers
There are quite a few Open Source load balancers in the market. I've chosen two of the more popular load balancers from that mix, NGINX Plus and Traefik proxy open source. I chose NGINX (pronounced engine-x) because it's a low-cost solution that has a LOT of options. I decided to use the Plus (paid) version due to some of the extra options that are available, such as the advanced session persistence. Traefik (pronounced traffic) proxy open source because I wanted a powerful, free solution to see what could be done with the least amount of investment. Just like I did with the Public Cloud Native Load Balancers, I created a comparison table for the Open Source Load Balancers.
|
NGINX Plus |
Traefik proxy open source |
|
|---|---|---|
| Load Balance Method(s) |
|
|
| Listener Types | HTTP/HTTPS, TCP, UDP | HTTP/HTTPS, TCP, UDP |
| Session Persistence | IP address | IP address |
| Health Monitor | HTTP/HTTPS, TCP, UDP | HTTP/HTTPS |
| Origin Server Target(s) | IP address, FQDN URL | IP address, FQDN URL |
| Cost (Cloud Provider + SW) | $15.55 + $0.48/hr | $0 + $0 |
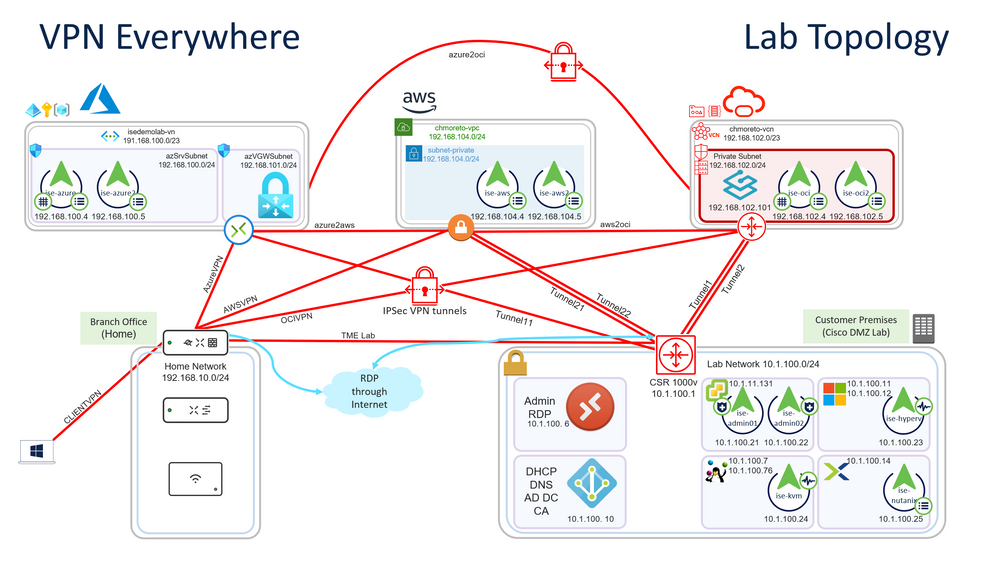
One of the major advantages of not using a Cloud Native load balancer is the ability to load balance between servers across networks. You can choose servers from AWS and on-premises, or go all out crazy like I did and load balance between AWS, Azure Cloud, OCI, and on-premises. In order to do this, a Site-to-Site VPN must be established between all clouds and to the on-premises network, as well as any branches you will be using. You can see from the diagram below that I am using my home network (Meraki) as my branch network, and even have a Client VPN setup so that I can access this network from anywhere.
NGINX Plus
(From Azure Marketplace)
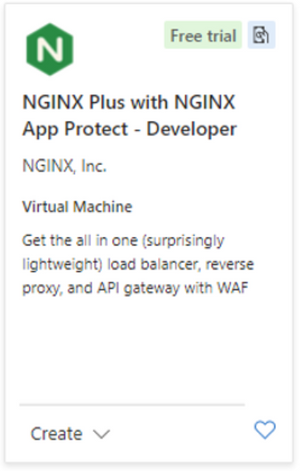
The application used to install NGINX Plus for the topology used in the webinar is NGINX Plus with NGINX App Protect - Developer as shown below
Install NGINX Plus
During the provisioning of the NGINX Server, I chose the Image Ubuntu Server 22.04 LTS - x64 Gen2, just due to my familiarity with the platform.
Provisioning this NGINX instance will also create a Network Interface and a Disk configuration. Then entries it created for me are
azure_nginx
azure_nginx945
azure_nginx_OsDisk_1_9ca1be42994643a69aee508af3f39790
azure_nginx is the name I chose for the NGINX VM, azure_nginx945 is the Network Interface that was created. Select the Network Interface and choose IP configurations. Here you can add the additional IP addresses to the interface.
Once the IP configurations are added to the Network Interface, ssh to the ubuntu instance (the username is azureuser) and add the additional IP addresses to the interface using the following file
sudo nano /etc/netplan/50-cloud-init.yamlAdd the IP addresses as shown, you can specify your DNS servers here, too, under nameservers
# This file is generated from information provided by the datasource.  Changes
# to it will not persist across an instance reboot.  To disable cloud-init's
# network configuration capabilities, write a file
# /etc/cloud/cloud.cfg.d/99-disable-network-config.cfg with the following:
# network: {config: disabled}
network:
    version: 2
    ethernets:
        enp0s3:
            dhcp4: true
            addresses: [192.168.100.106/24, 192.168.102.100/24, 192.168.100.103/24, 192.168.100.104/24]
            match:
                macaddress: 02:00:17:04:84:8f
            nameservers:
                addresses: [10.1.100.10]
            set-name: enp0s3
Restart the system networking with the command
sudo netplan applyConfigure NGINX Plus
NGINX uses different terminology for their Load Balancer functions, I'll correlate them here:
|
NGINX term |
Load Balancer term |
|---|---|
| listen | Listeners |
| proxy_pass | Assigns the Listener to the Backend Pool |
| upstream | Backend Pool |
Open the nginx.conf file /etc/nginx in nano, the relevant information is added to the stream section of this file.
stream {

################################################################################
#   Add this config to the `stream` section in the `/etc/nginx/nginx.conf` file
################################################################################
#
################################################################################
#   Define DNS server if different from the DNS Server in
#   `/etc/netplan/50-cloud-init.yaml`. Optional settings are
#   [valid=time] [ipv4=on|off] [ipv6=on|off] [status_zone=zone];
################################################################################
    resolver 10.1.100.10;

################################################################################
#    Session persistence can be done with hash (shown below), ip hash,
#    sticky learn, sticky route, and sticky cookie
#    (https://www.nginx.com/products/nginx/load-balancing/?_ga=2.200122726.976909272.1680211360-464606162.1679935068#session-persistence)
#
#    Load balancing methods to be used if session persistence is not used
#    `least_conn`, `least_time (connect | first_byte | last_byte [inflight])`, or `random`
#    (https://nginx.org/en/docs/stream/ngx_stream_upstream_module.html#least_conn)
################################################################################
#
################################################################################
#    `zone` entries are used for Active Health Checks.
#    https://docs.nginx.com/nginx/admin-guide/load-balancer/udp-health-check/
#
#    `max_fails` and `fail_timeout` are Passive Health Check entries.
#    in `upstream psn_auth2` below, if a server times out or sends an error
#    2 times in 30 seconds, the server is marked unavailable and is marked as such
#    for 30 seconds and is retired until a response is received and the server
#    is added back to the rotation
#    https://docs.nginx.com/nginx/admin-guide/load-balancer/udp-health-check/
################################################################################
    upstream psn_auth1 {
        # hash $remote_addr consistent;
        least_time;
        zone udp_zone 64k;
        server ise-aws.securitydemo.net:1812 weight=2;
        server ise-nutanix.securitydemo.net:1812 weight=4;
    }

    upstream psn_auth2 {
        # hash $remote_addr consistent;
        least_time;
        zone udp_zone 64k;
        server ise-azure.securitydemo.net:1812 max_fails=2 fail_timeout=30s;
        server ise-oci.securitydemo.net:1812 max_fails=2 fail_timeout=30s;
    }

    upstream psn_auth3 {
        # hash $remote_addr consistent;
        least_time last_byte;
        zone udp_zone 64k;
        server ise-azure2.securitydemo.net:1812 max_conns=3;
        server ise-oci2.securitydemo.net:1812 max_conns=5;
        server ise-aws2.securitydemo.net:1812 max_conns=7;
    }

    upstream psn_acct1 {
        # hash $remote_addr consistent;
        least_time;
        zone udp_zone 64k;
        server ise-aws.securitydemo.net:1813 weight=2;
        server ise-nutanix.securitydemo.net:1813 weight=4;
    }

    upstream psn_acct2 {
        # hash $remote_addr consistent;
        least_time;
        zone udp_zone 64k;
        server ise-azure.securitydemo.net:1813 max_fails=2 fail_timeout=30s;
        server ise-oci.securitydemo.net:1813 max_fails=2 fail_timeout=30s;
    }

    upstream psn_acct3 {
        # hash $remote_addr consistent;
        least_time last_byte;
        zone udp_zone 64k;
        server ise-azure2.securitydemo.net:1813 max_conns=3;
        server ise-oci2.securitydemo.net:1813 max_conns=5;
        server ise-aws2.securitydemo.net:1813 max_conns=7;
    }

    upstream psn_tacacs {
        # hash $remote_addr consistent;
        least_conn;
        zone tcp_zone 64k;
        server ise-aws.securitydemo.net:49 weight=2;
        server ise-nutanix.securitydemo.net:49 weight=4;
    }

################################################################################
#    `proxy_timeout` sets the timeout between two successive read or write
#    operations on client or proxied server connections. If no data is
#    transmitted within this time, the connection is closed.
#
#    `proxy_connect_timeout` defines a timeout for establishing a connection
#    with a proxied server.
#
#    The Active Health Check in NGINX is specified in the server blocks below
#    the `health_check` parameter is configured to your needs.  In the example
#    below, if NGINX receives an error or no response twice in 20 seconds,
#    the server is marked unresponsive and removed from the rotation until it
#    receives 2 responses in 20 seconds before marking it healthy and adding
#    it back to the rotation.
#    https://docs.nginx.com/nginx/admin-guide/load-balancer/udp-health-check/
################################################################################
    server {
        # If udp is not specified, tcp is used (default),
        # If ip address is not specified, system ip is used
        listen        192.168.100.102:1812 udp;
        proxy_pass    psn_auth1;
        proxy_timeout 3s;
        proxy_connect_timeout 1s;
        health_check  interval=20 passes=2 fails=2 udp;
    }

    server {
        listen        192.168.100.103:1812 udp;
        proxy_pass    psn_auth2;
        proxy_timeout 3s;
        proxy_connect_timeout 1s;
        health_check  interval=20 passes=2 fails=2 udp;
    }

    server {
        listen        192.168.100.104:1812 udp;
        proxy_pass    psn_auth3;
        proxy_timeout 3s;
        proxy_connect_timeout 1s;
        health_check  interval=20 passes=2 fails=2 udp;
    }

    server {
        listen        192.168.100.102:1813 udp;
        proxy_pass    psn_acct1;
        proxy_timeout 3s;
        proxy_connect_timeout 1s;
        health_check  interval=20 passes=2 fails=2 udp;
    }

    server {
        listen        192.168.100.103:1813 udp;
        proxy_pass    psn_acct2;
        proxy_timeout 3s;
        proxy_connect_timeout 1s;
        health_check  interval=20 passes=2 fails=2 udp;
    }

    server {
        listen        192.168.100.104:1813 udp;
        proxy_pass    psn_acct3;
        proxy_timeout 3s;
        proxy_connect_timeout 1s;
        health_check  interval=20 passes=2 fails=2 udp;
    }

    server {
        listen        192.168.100.102:49;
        proxy_pass    psn_tacacs;
        proxy_timeout 3s;
        proxy_connect_timeout 1s;
        health_check  interval=20 passes=2 fails=2;
    }
}
Save this file and restart NGINX Plus using the following command
sudo systemctl restart nginxRefer to the NGINX Load Balancer Admin Guide for additional options not covered in the nginx.conf file.
Resources
- Admin Guide TCP and UDP Load Balancing
- Admin Guide Deployment Guides
- The Power of Two (Random) Algorithm
- Choosing an NGINX Plus Load‑Balancing Technique
Traefik proxy open source
(Installed on OCI Always Free shape)
Why I chose Traefik to run in OCI
Traefik proxy open source (which I'll call Traefik from here on) is a free, open source Network Load Balancer. Sure, it doesn't offer all the Load Bancing methods as NGINX Plus (which is a paid version), no UDP Health Checks, and since it only uses cookies for session persistence, only HTTP/HTTPS services can be configured for "sticky sessions". This makes Traefik unsuitable for RADIUS Load Balancing. However, there are a few things about Traefik that intrigued me and made me want to configure it.
- 100% free open source load balancer
- 100% free compute resource in OCI
- Easy to use built in dashboard
- Traefik exports metrics natively for Prometheus to ingest
- Traefik exports Access Logs natively for ElasticSearch to ingest
The first two items were the most important. How to build a 100% cloud-hosted load balancer. You can achieve this with any free, open source software-based load balancer, NGINX open source, for example. Since I have detailed the NGINX configuration in an earlier section, I wanted to explore a different load balancer for this exercise.
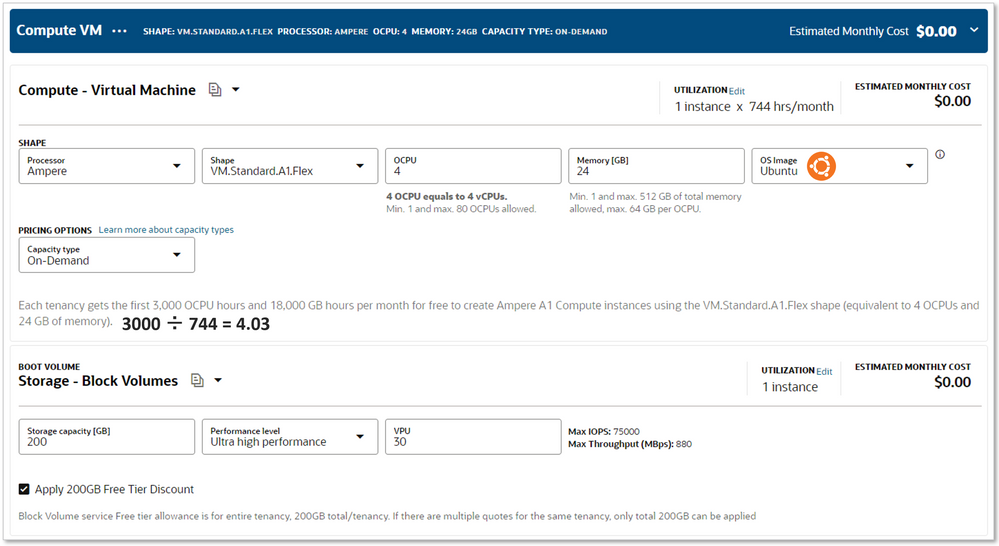
According to the Oracle Cloud Free Tier page, everyone gets 4 Ampere ARM CPU resources and a total of 200GB Block Volume storage FREE - FOREVER. This is part of the Always Free services just like the load balancer I detailed in the Oracle Cloud Infrastructure (OCI) Native section above.
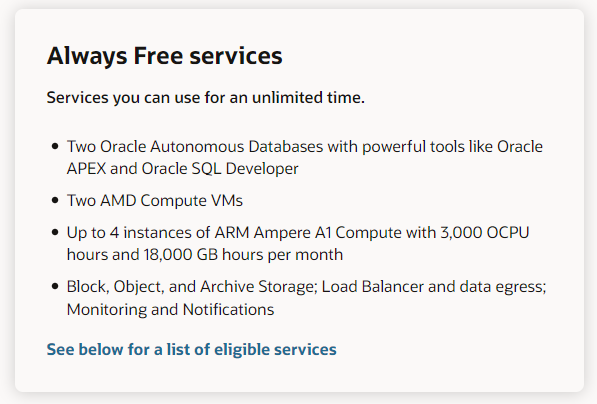
Using those possible resources, I put them into the same virtual instance with the free Ubuntu 22.04 operating system. As you can see, the Compute resource is allowed 3000 OCPU hours for 744 hours per month. There are 744 hours in a 31 day month, which makes this viable for every month in a year. If we divide the 3000 OCPU hours by the number of hours in a month (744), we are left with 4 (ok, 4.03), which is the number of processors that can be used with no cost. This also includes 24GB RAM at no cost.
Below that is the Storage Volume setting. Enter the amount of storage you want for the virtual instance and then enable the checkbox to Apply 200GB Free Tier Discount
Install an Ubuntu instance in OCI
I used an Ansible script to create my Free Tier machine, install Ubuntu, and add additional IP addresses. You can see this script in my GitHub repository if you'd like to automate the installation. If you do, then skip to the Install Traefik section, otherwise, read on!
To get started, log into Oracle Cloud and choose the hamburger menu, select Compute > Instances. Then select the Create instance button.
On this screen, name your instance, choose the compartment for creation and the Availability domain. Then choose the Change image button. On this slide-out, select Ubuntu and then Canonical Ubuntu 22.04 and choose the Select image button. Then select the Change shape button. Select Ampere and select the VM.Standard.A1.Flex. Notice the Always Free-eligible flag next to it. Now you can adjust your Number of OCPUs to 4 and your Amount of memory (GB) to 24. press the Select shape button.
Under Networking, choose the Virtual Cloud Network and subnet for your VM. Choose Show advanced options. If you are using network security groups to control traffic, enable this option and select your network security group. If you want a static IP address, enter this into the Private IPv4 address field, remember to use an IP address from the subnet you assigned. If you leave this blank, the IP address will be assigned via DHCP. You can choose to assign a provate DNS record or not. I have my own DNS server, so I don't use this. Enter the hostname you want to use in the Hostname field. Remember to add this hostname as a record in your DNS server.
Add an SSH key in the next block. If you already have an ssh key, you can upload it here, or paste the text of the key. If you do not, then you can create one here or choose No SSH keys. If you have an ISE instance in any cloud, you have an SSH key. You can use that same key here.
Finally, in the Boot volume block, enable the checkbox for Specify a boot volume size and enter 200.
Select the Create button.
Configure Ubuntu for multiple IP addresses
Once the instance is created, select it to view the instance details. Scroll down to the Resources menu and select Attached VNICs. Select the VNIC in the list. On this new page, under the Resources menu, choose IPv4 Addresses. Choose the button for Assign Secondary Private IP Address and specify the IP address. You can add an additional hostname at this time, to. We are not using public IPs, so the default of No public IP is good. Choose the Assign button.
Do this for as many Virtual IPs you need for your load balancer. Once this is completed, SSH into your new Ubuntu instance (the default username is ubuntu). If using an SSH key, the full command (from any linux/MacOS terminal) will be
ssh -o UserKnownHostsFile=/dev/null -o StrictHostKeyChecking=no -i ~/ise_key.pub ubuntu@192.169.102.101where ~/ise_key.pub is replaced with the path and key file on your computer.
The previous step for adding the IP addresses to the VNIC in the Oracle Cloud console was to let OCI know that these addresses will be used for this instance and to remove them from the pool of available addresses. Now we need to configure the ubuntu instance for the additional addresses.
Open the file 50-cloud-init.yaml with nano
sudo nano /etc/netplan/50-cloud-init.yamlAdd the addresses line and the nameservers section to the file and save (Ctrl+x)
# This file is generated from information provided by the datasource.  Changes
# to it will not persist across an instance reboot.  To disable cloud-init's
# network configuration capabilities, write a file
# /etc/cloud/cloud.cfg.d/99-disable-network-config.cfg with the following:
# network: {config: disabled}
network:
    version: 2
    ethernets:
        enp0s3:
            dhcp4: true
            addresses: [192.168.102.101/24, 192.168.102.105/24, 192.168.102.106/24, 192.168.102.107/24]
            match:
                macaddress: 02:00:17:04:84:8f
            nameservers:
                addresses: [10.1.100.10]
            set-name: enp0s3
Apply the changes and restart networking
sudo netplan applyInstall Traefik
I installed Traefik in the shell, not in docker or any other container, this installation option seems to be abnormal as I could only find instructions for installation in a Docker container. I'll provide the full installation process I used. If you would rather install in a Docker container, follow the Install Traefik instructions.
These instructions are run from the shell of the ubuntu instance you created in OCI. SSH to this instance to rune the commands.
Create a directory for Traefik and cd into it
mkdir traefik && cd traefikDownload the latest build from https://github.com/traefik/traefik/releases
wget https://github.com/traefik/traefik/releases/download/v2.10.1/traefik_v2.10.1_linux_arm64.tar.gzUnzip the archive
tar -zxvf traefik_v2.10.1_linux_arm64.tar.gzConfigure Traefik
Traefik configuration basics
Traefik configuration consists of two types of files: Static configuration and Dynamic configuration. The Static configuration identifies the listeners for the load balancer and tells Traefik where the Dynamic configuration files are located. This is also where you enable different features such as the API access, Dashboard, Metrics, Access Logs, etc.
For the Dynamic configuration files, Dynamic means just that, any changes to the dynamic configuration files are reflected immediately in the load balancer.
Traefik uses different terminology for their Load Balancer functions, I'll correlate them here:
|
Traefik term |
Load Balancer term |
|---|---|
| entryPoints | Listeners |
| routers | Assigns the Listener to the Backend Pool |
| services | Backend Pool |
Traefik configuration files
Create the static configuration file
# Static configuration
##############################################################################
# An `entryPoint` tells traefik to listen on specific ports.
# EntryPoints with an address formatted as :80 will use the system IP address.
# To use a specific alternate IP address inster the IP address before the port
# as shown below.  UDP ports _MUST_ be labeled as such, otherwise the
# default (tcp) will be used. For options and variables, visit
# https://doc.traefik.io/traefik/routing/entrypoints/
##############################################################################
entryPoints:
  unsecure:
    address: :80
  secure:
    address: :443
  metrics:
    address: :8082
  auth1:
    address: "192.168.102.105:1812/udp"
  auth2:
    address: "192.168.102.106:1812/udp"
  auth3:
    address: "192.168.102.107:1812/udp"
  acct1:
    address: "192.168.102.105:1813/udp"
  acct2:
    address: "192.168.102.106:1813/udp"
  acct3:
    address: "192.168.102.107:1813/udp"
  tacacs:
    address: "192.168.102.105:49"
  web:
    address: "192.168.102.106:8443"

##############################################################################
# The `providers` section lists the services that exist on your infrastructure
# In this example, I use a File Provider that will enable a dynamic
# configuration to be used.  The `watch: true` flag will monitor the file
# (or folder) for changes and immediately implement them
# For options and variables, visit
# https://doc.traefik.io/traefik/routing/overview/
##############################################################################
providers:
  file:
    # filename: "config/radius.yaml"
    #######################################################################
    # To use a single file instead of a directory, un-comment the line
    # above and add the path to your dynamic configuration files
    # (comment out or delete the `directory` entry below).
    #######################################################################
    directory: config
    watch: true

##############################################################################
# To enable the Traefik dashboard add this section
# For options and variables, visit
# https://doc.traefik.io/traefik/operations/dashboard/
##############################################################################
api:
  dashboard: true
  insecure: true
Create the dynamic configuration file. The dynamic configurations have different requirements based upon the traffic for which they are configured. Samples of each are in the config folder in my GitHub repository. We'll focus on the UDP configuration file here.
# Dynamic RADIUS configuration
#############################################################################################
# Each protocol (http, tcp, udp) needs its own dynamic configuration file.
# The `routers` below are simply how to define the entrypoint and assign it to a
# server group under `services`.  The `router` name is arbitrary in this file, but
# should be a meaningful name.
#
# udp:                      # Protocol
#   routers:                # To begin the `routers` context
#     auth1router:          # Name fo the router
#       entryPoints:        # EntryPoints are defined in the Static Configuration File
#       - auth1             # The entryPoint from the Static Configuration File to be assigned
#       service: radius-1   # The server group (below) to which the entryPoint is assigned
#############################################################################################
udp:
  routers:
    auth1router:
      entryPoints:
      - auth1
      service: radius-1
    auth2router:
      entryPoints:
      - auth2
      service: radius-2
    auth3router:
      entryPoints:
      - auth3
      service: radius-3
    acct1router:
      entryPoints:
      - auth1
      service: acct-1
    acct2router:
      entryPoints:
      - auth2
      service: acct-2
    acct3router:
      entryPoints:
      - auth3
      service: acct-3

#############################################################################################
# The `services` section assigns the backend servers to the entryPoint.  The `service` name
# (radius-1) is arbitrary, but should be meaningful and is referenced above in the `routers`
# section.
#############################################################################################
  services:
    radius-1:
      loadBalancer:
        servers:
          - address: "192.168.104.4:1812"
          - address: "10.1.100.25:1812"
    radius-2:
      loadBalancer:
        servers:
          - address: "192.168.100.4:1812"
          - address: "192.168.102.4:1812"
    radius-3:
      loadBalancer:
        servers:
          - address: "192.168.100.5:1812"
          - address: "192.168.102.5:1812"
          - address: "192.168.104.5:1812"
    acct-1:
      loadBalancer:
        servers:
          - address: "192.168.104.4:1813"
          - address: "10.1.100.25:1813"
    acct-2:
      loadBalancer:
        servers:
          - address: "192.168.100.4:1813"
          - address: "192.168.102.4:1813"
    acct-3:
      loadBalancer:
        servers:
          - address: "192.168.100.5:1813"
          - address: "192.168.102.5:1813"
          - address: "192.168.104.5:1813"
Configure logging
Following this section will require you to move your configuration files and logs to /etc/traefik. Be sure to update the traefik.yaml static configuration file with the new locations.
Make traefik executable and move to /usr/local/bin
sudo chmod +x traefik
sudo cp traefik /usr/local/bin
sudo chown root:root /usr/local/bin/traefik
sudo chmod 755 /usr/local/bin/traefik
Give the traefik binary the ability to bind to privileged ports (80, 443) as non-root
sudo setcap 'cap_net_bind_service=+ep' /usr/local/bin/traefikSetup traefik user and group and permissions
sudo groupadd -g 321 traefik
sudo useradd -g traefik --no-user-group --home-dir /var/www --no-create-home --shell /usr/sbin/nologin --system --uid 321 traefik
sudo usermod traefik -aG traefik
Make a globally accessible folder path
sudo mkdir /etc/traefik
sudo mkdir /etc/traefik/config
sudo mkdir /etc/traefik/logs
sudo mkdir /etc/traefik/acme
sudo chown -R root:root /etc/traefik
sudo chown -R traefik:traefik /etc/traefik/config /etc/traefik/logs
Setup Service
This will ensure that Traefik continues to run once you disconnect your SSH session
Create the file /etc/systemd/system/traefik.service with the following content
[Unit]
Description=Traefik
Wants=network-online.target
After=network-online.target

[Service]
User=traefik
Group=traefik
Restart=always
Type=simple
ExecStart=/usr/local/bin/traefik \
    --config.file=/etc/traefik/traefik.yaml\

[Install]
WantedBy=multi-user.target
Then run the following commands
sudo chown root:root /etc/systemd/system/traefik.service
sudo chmod 644 /etc/systemd/system/traefik.service
sudo systemctl daemon-reload
sudo systemctl start traefik.service
To enable autoboot use this command
sudo systemctl enable traefik.serviceTo restart the traefik service
sudo systemctl restart traefik.serviceRun Traefik
From the traefik/ folder run
sudo ./traefikYou should receive an INFO message as shown below
INFO[0000] Configuration loaded from file: /home/ubuntu/traefik/traefik.yamlConfigure Traefik for Prometheus
Add the following to your static configuration (traefik.yaml)
##############################################################################
# To output metrics to Prometheus add the following section
# For options and variables, visit
# https://doc.traefik.io/traefik/observability/metrics/prometheus/
##############################################################################
metrics:
  prometheus:
    addEntryPointsLabels: true
    addRoutersLabels: true
    addServicesLabels: true
    headerLabels:
      label: headerKey
    entryPoint: metrics
Save this file and restart Traefik
Add Traefik as a Data source for Infrastructure Monitoring in ISE
⚠ This step can only be completed once Prometheus is installed and configured. Visit https://github.com/ISEDemoLab/Cloud_Based_Load_Balancers/tree/main/prometheus to learn how to install Prometheus on your Traefik instance.
Prometheus is used as a Data source for Grafana which is embedded into ISE versions 3.2 and newer. In this step, I'll walk you through adding a Data source and new dashboard to monitor your Traefik Load Balancer within ISE.
Log in to the ISE Web GUI and navigate to Operations > System 360 > Monitoring. Click the
Add a new dashboard for Traefik in ISE
While in Infrastructure Monitoring, select the
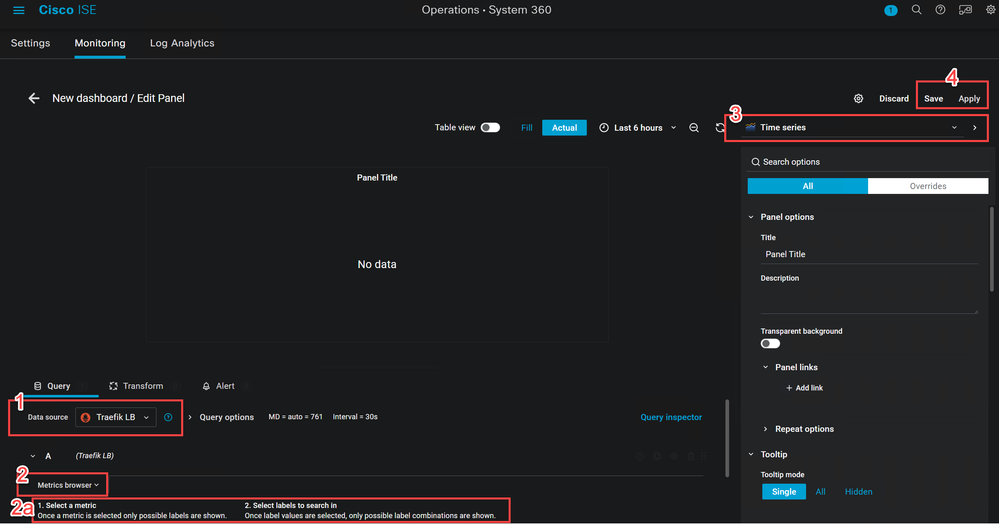
From the Data source dropdown (1), change from Prometheus to what you named your Traefik Data source, I named mine Traefik LB so I chose that. You can also choose Mixed to add metrics from multiple data sources.
Just below the Data Source you'll see another dropbown for Metrics browser (2). Select the metric you'd like to view and then choose the labels to search (2a). When you have this, select the Use query button.
Then use the Visualizations dropdown (3) to select how the data is presented.
Finally, Save to save the visualization and Apply (4) to exit edit mode and return to the dashboard
Configure Traefik for ElasticSearch
ElasticSearch is used in the ELK Stack (ElasticSearch, LogStash, Kibana) to create visualizations based on log information. The configuration below outputs the logs from Traefik into ElasticSearch Native JSON format.
Add the following to your static configuration (traefik.yaml)
##############################################################################
# To configure access logging add this section
# This will allow you to use LogStash or ElasticSearch to parse the logs
# For options and variables, visit
# https://doc.traefik.io/traefik/observability/access-logs/
##############################################################################
accessLog:
  filePath: "/logs/access.log"
  bufferingSize: 100
  format: json
  filters:
    statusCodes:
      - "200"
      - "300-302"
    retryAttempts: true
    minDuration: "10ms"
Save this file and restart Traefik
Unfortunately, Log Analytics in ISE (the embedded ELK stack) does not allow for additional data sources like Infrastructure Monitoring does.
Cisco Catalyst RADIUS Load Balancing
This is a command that has been porterd into IOS-XE from IOS and is available in virtually every version of IOS-XE.
You can use a built in command on Catalyst switches to load balance RADIUS requests. By adding
load-balance method least-outstandingto your aaa server group, you are configuring load balancing to the PSNs in your server group to the server with the least number of outstanding sessions with a default group of 25 (25 cached authentications/authorizations)
The full command is
load-balance method least-outstanding [batch-size number] [ignore-preferred-server]where you can assign the batch number and remove the preferred server. In this case, the preferred-server adds session persistence, so do not ignore-preferred-server!
The RADIUS command that are needed for IOS-XE are below
radius-server dead-criteria time 5 tries 3
radius-server deadtime 3
!
radius server PSN01
address ipv4 192.168.100.4 auth-port 1812 acct-port 1813
!
radius server PSN02
address ipv4 10.1.100.25 auth-port 1812 acct-port 1813
!
aaa group server radius ISE-Gr01
server name PSN02
server name PSN01
load-balance method least-outstanding
!
aaa session-id common
aaa authentication dot1x default group ISE-Gr01
aaa authorization network default group ISE-Gr01
aaa accounting identity default start-stop group ISE-Gr01
aaa accounting network default start-stop group ISE-Gr01
aaa accounting update newinfo periodic 2880
!
aaa server radius dynamic-author
client 192.168.100.4 server-key ISEisC00L
client 10.1.100.25 server-key ISEisC00L
These commands contain everything that is needed for a load balancer, such as:
Health Checks
radius-server dead-criteria time 5 tries 3
radius-server deadtime 3
Backend Servers
radius server PSN01
address ipv4 192.168.100.4 auth-port 1812 acct-port 1813
!
radius server PSN02
address ipv4 10.1.100.25 auth-port 1812 acct-port 1813
Backend Pool and Load Balance Method
aaa group server radius ISE-Gr01
server name PSN02
server name PSN01
load-balance method least-outstanding
Session Persistence
The omission of ignore-preferred-server as noted above enables session persistence.
For more information read the RADIUS Server Load Balancing chapter of the Security Configuration Guide, Cisco IOS XE Dublin 17.11.x
Testing the Load Balancers
The test scripts used are very simple scripts using radtest which is part of the freeradius-utils package. If you do not have it already, use
sudo apt install freeradius-utils -yto install it. Then you can create your own test script.
RADTest
radtest
Usage: radtest [OPTIONS] user passwd radius-server[:port] nas-port-number secret [ppphint] [nasname]
        -d RADIUS_DIR       Set radius directory
        -t <type>           Set authentication method
                            type can be pap, chap, mschap, or eap-md5
        -P protocol         Select udp (default) or tcp
        -x                  Enable debug output
        -4                  Use IPv4 for the NAS address (default)
        -6                  Use IPv6 for the NAS address
Script
In this example, I will use a script named test.sh
#!/usr/bin/bash
for seq in $(seq 100)
do
    echo $seq
    radtest cmoreton ISEisC00L 192.168.100.6:1812 $seq ISEisC00L
done
Make test.sh executable with chmod 755 test.sh
Run the test.sh script with ./test.sh
The commands in the script are:
|
Command |
Function |
|---|---|
#!/usr/bin/bash |
#!/usr/bin/bash is a shebang line used in script files to set bash, present in the '/bin' directory, as the default shell for executing commands present in the file. It defines an absolute path /usr/bin/bash to the Bash shell. |
for seq in $(seq 100) |
Create a for...in...do loop and set the variable $seq to 100 so that it runs 100 times |
do |
Execute the command |
echo $seq |
Echo the command as many times as defined in the variable $seq |
radtest...$seq |
The full command to be run, including the variable |
done |
Script end |
I have all my test scripts in my GitHub repository
Verify Load Balancer Function in ISE
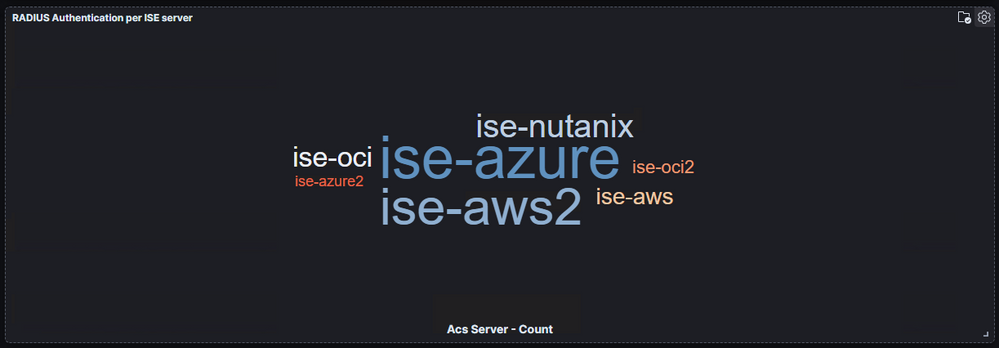
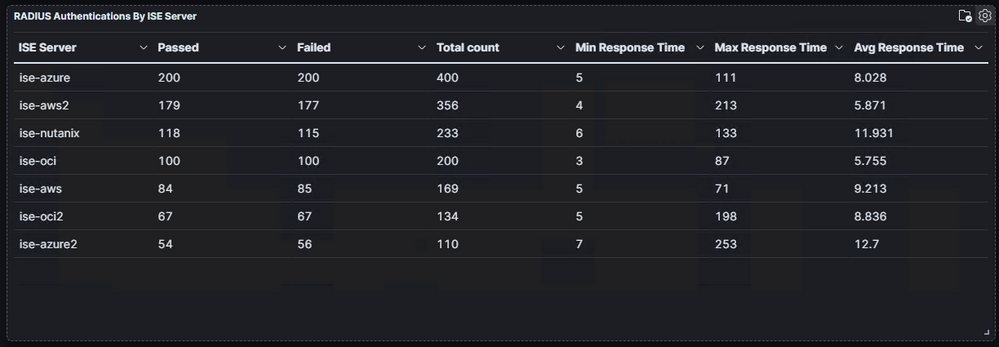
Sure, you can look in the RADIUS Live Logs to see the authentications coming in and you can even monitor the server (PSN) to which the authentications are going. This approach is tedious, though and the RADIUS Live Logs only allow you to go back 24 hours. This is one of the MANY reasons I am so thankful for the System 360 Log Analytics that was introduced in ISE 3.2.
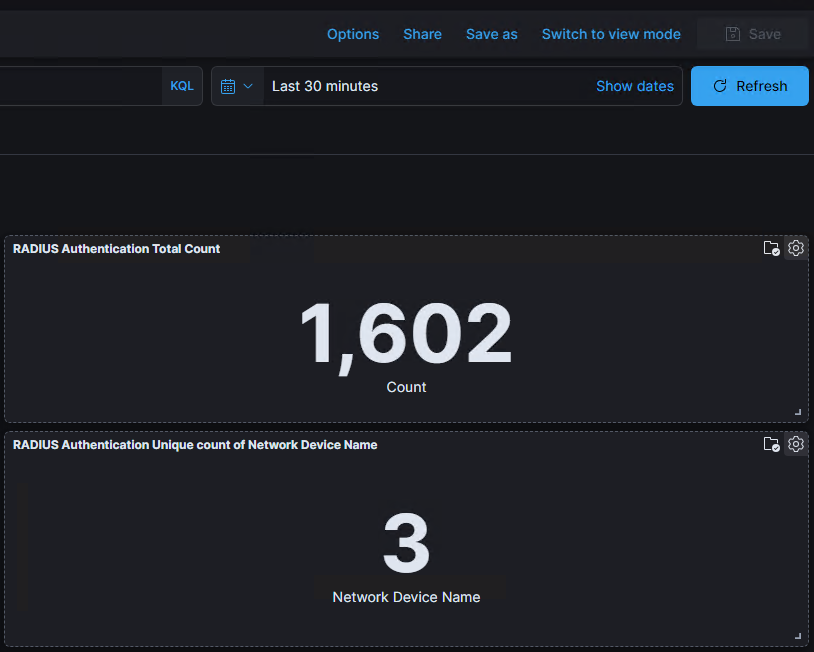
I use the RADIUS Authentication Summary dashboard to monitor the authentications coming in to ISE. Log Analytics has built in selectors to read logs from the Last 1 year. You can also input your own custom tie range including years!
As you can see here, one of the first things you see is the total number of authentications for the timeframe you select and the number of Network devices that were used for those authentications.
Here are a few more panels that I find useful
But this one saves a TON of time so that I don't have to count the authentications per PSN
Resources
How To: Cisco & F5 Deployment Guide: ISE Load Balancing Using BIG-IP
cs.co/ise-f5
ISE Deployment with Load Balancing
cs.co/ise-lb-bp
IOS-XE RADIUS Configuration Guide
cs.co/ios-lb
Git Repository
github.com/ISEDemoLab/Cloud_Based_Load_Balancers
Find answers to your questions by entering keywords or phrases in the Search bar above. New here? Use these resources to familiarize yourself with the community:
