- Cisco Community
- Technology and Support
- Data Center and Cloud
- UCS Director
- UCS Director Knowledge Base
- Building a Dashboard view in UCS Director using the Dashing toolkit
- Subscribe to RSS Feed
- Mark as New
- Mark as Read
- Bookmark
- Subscribe
- Printer Friendly Page
- Report Inappropriate Content
- Subscribe to RSS Feed
- Mark as New
- Mark as Read
- Bookmark
- Subscribe
- Printer Friendly Page
- Report Inappropriate Content
on
05-13-2015
06:25 AM
- edited on
03-25-2019
01:28 PM
by
ciscomoderator
![]()
This document builds up an example of querying the UCS Director REST API to pull information across the data centre. Using the Ruby programming language, this guide will start with some basic building blocks before producing real-time, informative dashboards via the Dashing platform.
This document assumes a general understanding of the UCS Director platform, as well as basic programming skills. Examples (as well as the Dashing platform itself) will be coded in Ruby and all source code is included.

Accessing the REST API
The UCS Director API is relatively straightforward and well-documented. In particular, most functions can be accessed directly from the user interface. In order to do this, log in with the intended user and click their name in the top-right:

On the advanced tab the option to enable developer menu (for this session) can be checked to allow easy access. The rest of this guide assumes this option is enabled. In addition, copy the REST API Access Key – you will need this later.

Using the REST API to get a list of VMs
As a simple example, navigate to Virtual => Compute within the system and click the VM tab.
Provided the developer menu is enabled a button labelled Report Metadata is now available. Clicking it will provide further information, including a REST URL to call at the bottom.
In this case the URL is:
http://ipaddr/app/api/rest?opName=userAPIGetTabularReport&opData={param0:"0",param1:"All Clouds",param2:"VMS-T0"}
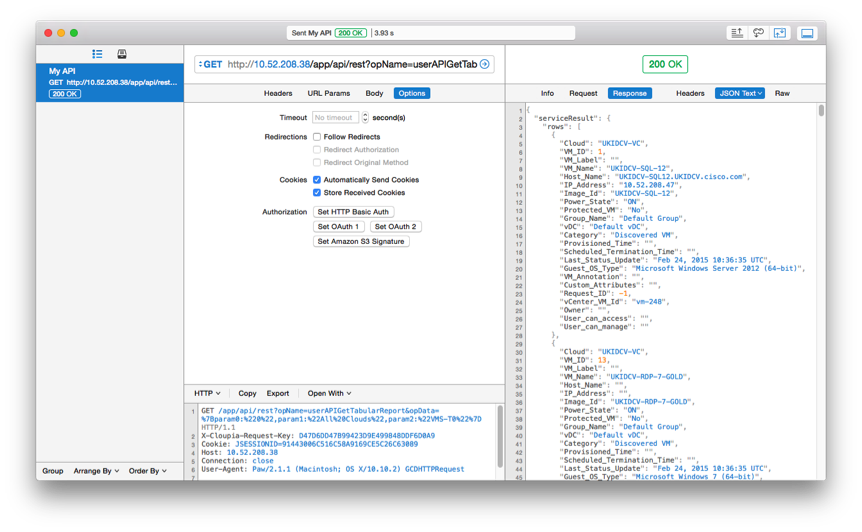
Taking this URL, your API Key and a REST client (such as Postman, Paw or even curl) you can get a JSON-formatted list of all VMs managed by UCS Director.
You will also need to add the API key from earlier as a header:
X-Cloupia-Request-Key = your-api-key
Sample REST call output:
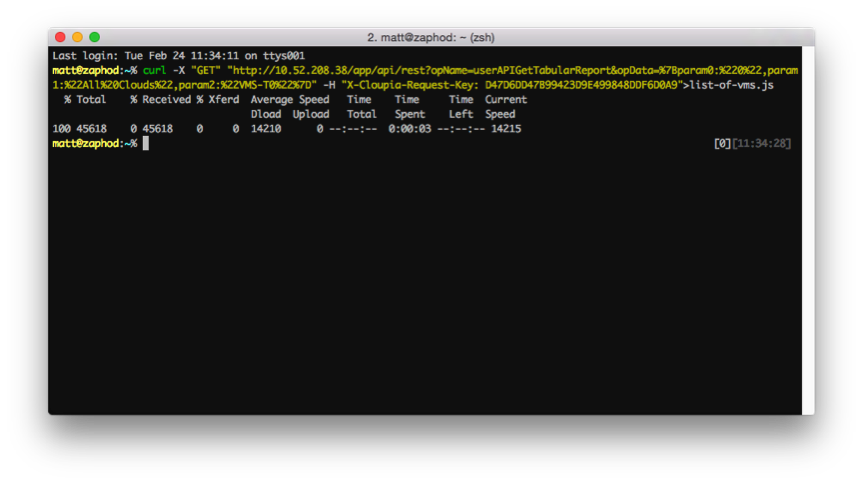
With CURL:
curl -X "GET" \
"http://ipaddr/app/api/rest?opName=userAPIGetTabularReport&opData=%7Bparam0:%220%22,param1:%22All%20Clouds%22,param2:%22VMS-T0%22%7D" \
-H "X-Cloupia-Request-Key: your-api-key"
Now that the response has come back, it can be used programmatically in Dashing to provide a widget showing our top VMs per operating system.
The above query can be easily done via a Ruby script, which is the first step to creating a dashboard. The first example is to use the built-in libraries to request the list of VMs
# Add needed libraries
require 'net/http'
require 'json'
# UCS Director API Key
ipaddr = 'ucsd-ip-address'
api_key = 'your-api-key'
# The URI from above, split over a few lines (replace ipaddr as needed)
uri = URI(URI.escape('http://' + ipaddr + '/app/api/rest?' +
'opName=userAPIGetTabularReport&opData={param0:"0",' +
'param1:"All Clouds",param2:"VMS-T0"}'))
# Build an HTTP header
http_request = Net::HTTP::Get.new(uri.request_uri)
# Add the API key
http_request.add_field("X-Cloupia-Request-Key", api_key)
# Fetch it:
http_response = Net::HTTP.start(uri.hostname, uri.port) {|http|
http.request(http_request)
}
# Check response for http 200 (OK) and print the output
if (http_response.code == "200") then
print http_response.body
end
Running this code should yield output such as the below (truncated to show a single VM):
{
"serviceResult": {
"rows": [
{
"Cloud": "UKIDCV-VC",
"VM_ID": 1,
"VM_Label": "",
"VM_Name": "UKIDCV-SQL-12",
"Host_Name": "UKIDCV-SQL12.UKIDCV.cisco.com",
"IP_Address": "10.52.208.47",
"Image_Id": "UKIDCV-SQL-12",
"Power_State": "ON",
"Protected_VM": "No",
"Group_Name": "Default Group",
"vDC": "Default vDC",
"Category": "Discovered VM",
"Provisioned_Time": "",
"Scheduled_Termination_Time": "",
"Last_Status_Update": "Feb 24, 2015 10:36:35 UTC",
"Guest_OS_Type": "Microsoft Windows Server 2012 (64-bit)",
"VM_Annotation": "",
"Custom_Attributes": "",
"Request_ID": -1,
"vCenter_VM_Id": "vm-248",
"Owner": "",
"User_can_access": "",
"User_can_manage": ""
},
}
}
By correlating all this information in ruby we can provide a simple count of the number of VMs per operating system (“Guest_OS_Type”). Using Ruby this can be achieved using the hash type:
# Parse http response using above library
response = JSON.parse(http_response.body)
vm_count = Hash.new(0)
# Iterate through each of the rows above
response["serviceResult"]["rows"].each do |vm|
# Increment the counter for this particular OS type
vm_count[vm["Guest_OS_Type"]] += 1
end
The resulting vm_count hash will then contain each OS and how many instances it has. We can sort this and print it out in a meaningful way:
# Sort the vm array by value from most to least and print each line:
vm_count.keys.sort_by { |key| vm_count[key] }.reverse.each do |key|
print key + " = " + vm_count[key].to_s + "\n"
end
Putting it all together and editing some steps the following program is created:
# Add needed libraries
require 'net/http'
require 'json'
# UCS Director API Key
ipaddr = 'ucsd-ip-address'
api_key = 'your-api-key'
# The URI from above, split over a few lines (replace ipaddr as needed)
uri = URI(URI.escape('http://' + ipaddr + '/app/api/rest?' +
'opName=userAPIGetTabularReport&opData={param0:"0",' +
'param1:"All Clouds",param2:"VMS-T0"}'))
# Build an HTTP header
http_request = Net::HTTP::Get.new(uri.request_uri)
# Add the API key
http_request.add_field("X-Cloupia-Request-Key", api_key)
# Fetch it:
http_response = Net::HTTP.start(uri.hostname, uri.port) {|http|
http.request(http_request)
}
# Check response for http 200 (OK) and print the output
if (http_response.code == "200") then
# Parse http response using above library
response = JSON.parse(http_response.body)
vm_count = Hash.new(0)
# Iterate through each of the rows above
response["serviceResult"]["rows"].each do |vm|
# Increment the counter for this particular OS type
vm_count[vm["Guest_OS_Type"]] += 1
end
# Sort the vm array by value from most to least and print each line:
vm_count.keys.sort_by { |key| vm_count[key] }.reverse.each do |key|
print key + " = " + vm_count[key].to_s + "\n"
end
end
Running this in ruby should give similar output:
% ruby vm_count.rb
Debian GNU/Linux 6 (64-bit) = 18
Red Hat Enterprise Linux 6 (64-bit) = 15
Microsoft Windows 8 (64-bit) = 13
Ubuntu Linux (64-bit) = 9
Microsoft Windows Server 2012 (64-bit) = 5
Other 2.6.x Linux (64-bit) = 5
Other (32-bit) = 3
Red Hat Enterprise Linux 5 (32-bit) = 3
Microsoft Windows Server 2008 R2 (64-bit) = 2
SUSE Linux Enterprise 11 (64-bit) = 2
Microsoft Windows 7 (64-bit) = 2
Other 2.6.x Linux (32-bit) = 1
CentOS 4/5/6/7 (64-bit) = 1
Red Hat Enterprise Linux 5 (64-bit) = 1
Debian GNU/Linux 7 (64-bit) = 1
Other (64-bit) = 1
Creating Dashing Widget
Dashing (http://dashing.io) is built around dashboards (a large screen display), widgets (components within a dashboard) and jobs (tasks that update the widgets). This paper will focus on the last of these, creating jobs that query UCS Director for information.
Installing Dashing
You will need Ruby version 1.9 or later. All of these examples have been tested on both Debian GNU/Linux and Mac OS X. First, as per the Dashing instructions, install Dashing and Bundle via gem (might need root privileges):
gem install dashing bundle
Next create a UCS Director dashboard:
dashing new ucs_director_dashboard
cd ucs_director_dashboard
Install dependencies
bundle
Creating a job file
Now that you have set up dashing correctly, you should see a directory structure as follows:
% ls
Gemfile README.md config.ru jobs public
Gemfile.lock assets dashboards lib widgets
The first task is to create a new job file to get the vm list created earlier. In this folder create a file called vm_by_os.rb.
A job file in Dashing is written in Ruby and is automatically launched when the dashing server is started. Unlike a regular application though, we need to schedule these tasks to run at specific intervals.
In this example, the interval will be set to 60 seconds:
SCHEDULER.every '60s' do
# Code will go here
end
Dashing uses Batman Bindings to send events to its dashboards. This means you can send events without explicit coupling between them, for example:
# This will send an event to a dashboard widget called vm_by_os
send_event('vm_by_os', { items: vm_sorted_count.values })
The dashboard configuration (done later) itself is simple html:
<div data-id="vm_by_os" data-view="List" data-unordered="true" data-title="VMs by OS" data-moreinfo="# of VMs seen">
</div>
Expanding the code created earlier, the vm_by_os.rb file will look like this:
# Add needed libraries
require 'net/http'
require 'json'
# UCS Director API Key
ipaddr = 'ucsd-ip-address'
api_key = 'your-api-key'
# The URI from above, split over a few lines (replace ipaddr as needed)
uri = URI(URI.escape('http://' + ipaddr + '/app/api/rest?' +
'opName=userAPIGetTabularReport&opData={param0:"0",' +
'param1:"All Clouds",param2:"VMS-T0"}'))
# Run this task every 60 seconds
SCHEDULER.every '60s' do
# Build an HTTP header
http_request = Net::HTTP::Get.new(uri.request_uri)
# Add the API key
http_request.add_field("X-Cloupia-Request-Key", api_key)
# Fetch it:
http_response = Net::HTTP.start(uri.hostname, uri.port) {|http|
http.request(http_request)
}
# Check response for http 200 (OK) and parse the output
if (http_response.code == "200") then
# Parse http response using above library
response = JSON.parse(http_response.body)
vm_count = Hash.new(0)
vm_sorted_count = Hash.new(0)
# Iterate through each of the rows above
response["serviceResult"]["rows"].each do |vm|
# Increment the counter for this particular OS type
vm_count[vm["Guest_OS_Type"]] += 1
end
# Sort the vm array by value from most to least and print each line:
vm_count.keys.sort_by { |key| vm_count[key] }.reverse.each do |key|
# Correct format for 'List' widget
vm_sorted_count[key] = { label: key,
value: (vm_count[key].to_i) }
end
# Send the event:
send_event('vm_by_os', { items: vm_sorted_count.values })
end
end
Creating a Dashboard
Now that the job task is completed, the next phase is to create a dashboard in which to show the UCS Director statistics.
In the dashboards directory are a number of files, each representing a different view. Create a new file called ucsd.erb in the dashboards directory with the following contents:
<% content_for :title do %>UCS Director Dashboard<% end %>
<div class="gridster">
<ul>
<li data-row="1" data-col="1" data-sizex="2" data-sizey="1">
<div data-id="welcome" data-view="Text" data-title="Hello" data-text="This is your shiny new dashboard." data-moreinfo="Protip: You can drag the widgets around!"></div>
</li>
<li data-row="2" data-col="1" data-sizex="1" data-sizey="1">
<div data-id="synergy" data-view="Meter" data-title="Synergy" data-min="0" data-max="100"></div>
</li>
<li data-row="1" data-col="3" data-sizex="2" data-sizey="2">
<div data-id="vm_by_os" data-view="List" data-unordered="true" data-title="VMs by OS" data-moreinfo="# of VMs seen"></div>
</li>
<li data-row="2" data-col="1" data-sizex="1" data-sizey="1">
<div data-id="valuation" data-view="Number" data-title="Current Valuation" data-moreinfo="In billions" data-prefix="$"></div>
</li>
</ul>
Save this file when done.
Running Dashing
In your ucs_director_dashboard folder enter the following command:
dashing start
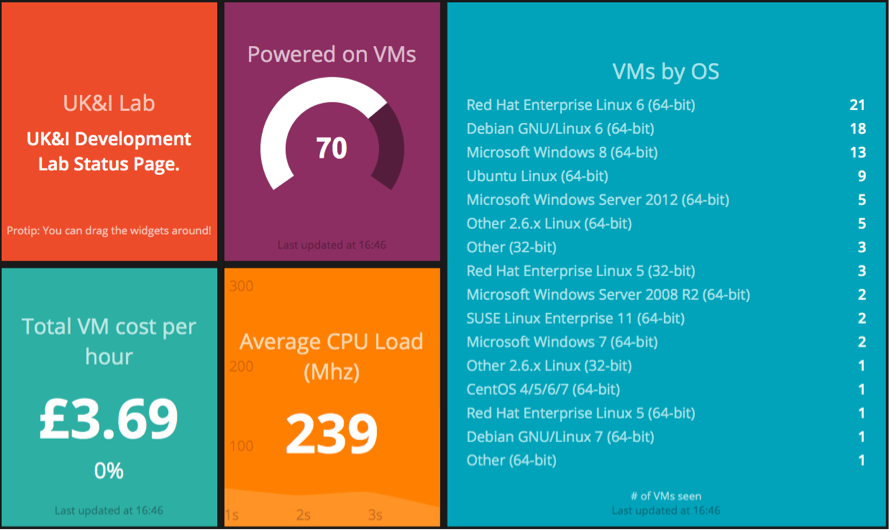
Then navigate to http://<server-ip>:3030/ucsd (e.g. http://127.0.0.1:3030/ucsd):
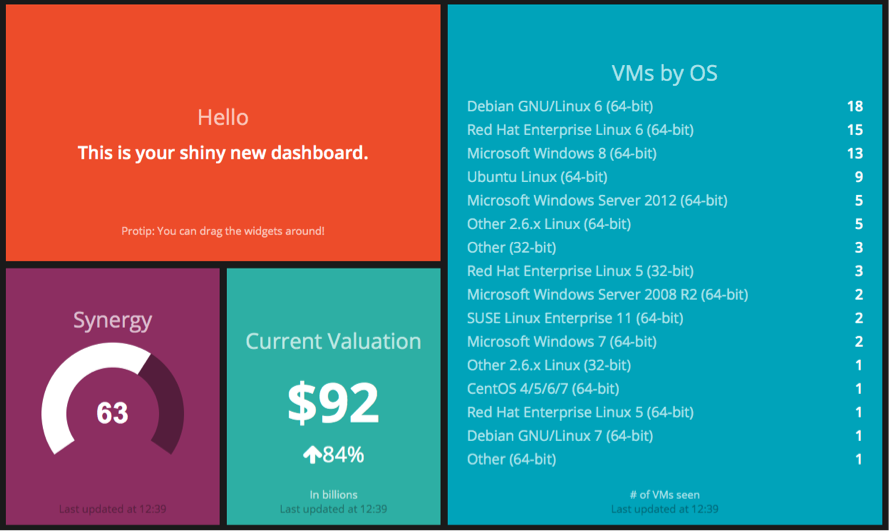
The job to update the VM list will run every 60 seconds and pull this information directly from UCS Director. You can kill the process by pressing Ctrl-C or by closing the terminal window.
Creating a chargeback view
More jobs can be created in a similar way. For example, the ‘Current Valuation’ item can be replaced with chargeback data from UCS Director. Using the userAPIGetTabularReport API request another job can be created:
# Add needed libraries
require 'net/http'
require 'json'
# UCS Director values
ipaddr = 'ucsd-ip-address'
api_key = 'your-api-key'
# The URI from above, split over a few lines (replace ipaddr as needed)
uri = URI(URI.escape('http://' + ipaddr + '/app/api/rest?' +
'opName=userAPIGetTabularReport&opData={param0:"6",' +
'param1:"",param2:"CHARGEBACK-T12"}'))
# Keep track of costs:
last_cost = 0
# Run this task every 60 seconds
SCHEDULER.every '60s' do
# Build an HTTP header
http_request = Net::HTTP::Get.new(uri.request_uri)
# Add the API key
http_request.add_field("X-Cloupia-Request-Key", api_key)
# Fetch it:
http_response = Net::HTTP.start(uri.hostname, uri.port) {|http|
http.request(http_request)
}
# Check response for http 200 (OK) and parse the output
if (http_response.code == "200") then
# Parse http response using above library
response = JSON.parse(http_response.body)
current_cost = 0
# Iterate through each of the rows above
response["serviceResult"]["rows"].each do |vm|
# Only process VMs with meaningful data:
if ((vm["Active_VM_Hours"] + vm["Inactive_VM_Hours"]) > 0) then
# Calculate total time and cost
total_time = (vm["Active_VM_Hours"].to_f +
vm["Inactive_VM_Hours"].to_f)
total_cost = (vm["Total_Cost"] - vm["One_time_Cost"])
# Work out its average cost per hour
current_cost += (total_cost / total_time)
end
# Round to 2 decimal places
current_cost = current_cost.round(2)
end
# Send the event:
send_event('cost_per_hour', { current: current_cost,
last: last_cost })
end
end
Then a simple Number widget on a dashboard would display it:
<li data-row="2" data-col="1" data-sizex="1" data-sizey="1">
<div data-id="cost_per_hour" data-view="Number" data-title="Total VM cost per hour" data-moreinfo="" data-prefix="£"></div>
</li>
Output
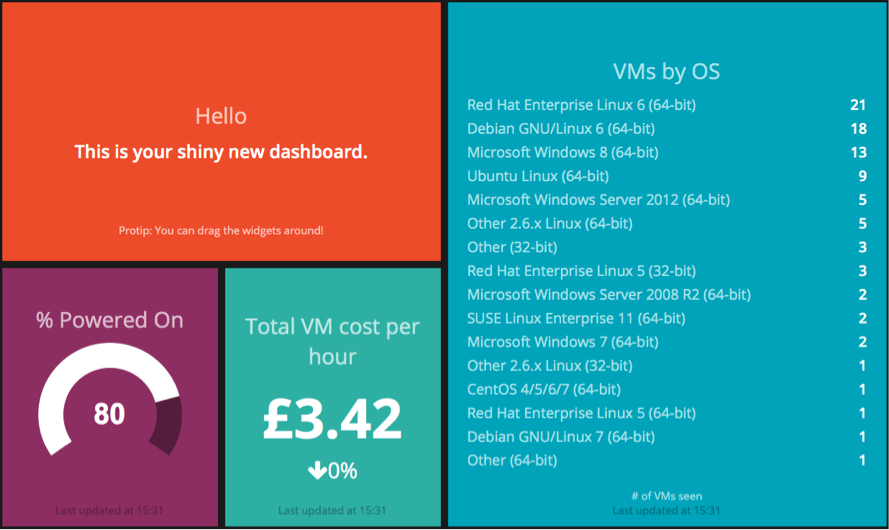
We now have costing information integrated in to the dashboard for a quick glance of our total productivity. As this is pulled from UCS Director’s policy there’s a single place to obtain and manage this information.

Calculating the total % of powered-on VMs
The final built-in element to replace for a full dashboard view is the ‘Synergy’ widget. This shows a dial on a scale of a user-customisable value. By using the API calls to obtain a full list of VMs, the total % powered on can be obtained.
# Add needed libraries
require 'net/http'
require 'json'
# UCS Director API Key
ipaddr = 'ucsd-ip-address'
api_key = 'your-api-key'
# The URI from above, split over a few lines (replace ipaddr as needed)
uri = URI(URI.escape('http://' + ipaddr + '/app/api/rest?' +
'opName=userAPIGetTabularReport&opData={param0:"0",' +
'param1:"All Clouds",param2:"VMS-T0"}'))
# Run this task every 60 seconds
SCHEDULER.every '60s' do
# Build an HTTP header
http_request = Net::HTTP::Get.new(uri.request_uri)
# Add the API key
http_request.add_field("X-Cloupia-Request-Key", api_key)
# Fetch it:
http_response = Net::HTTP.start(uri.hostname, uri.port) {|http|
http.request(http_request)
}
# Check response for http 200 (OK) and parse the output
if (http_response.code == "200") then
# Parse http response using above library
response = JSON.parse(http_response.body)
total_vm = 0
powered_vm = 0
# Iterate through each of the rows above
response["serviceResult"]["rows"].each do |vm|
total_vm += 1
if (vm['Power_State'] == 'ON') then
powered_vm += 1
end
# Send the event:
powered_on_percent = ((powered_vm.to_f / total_vm.to_f)
* 100).round(0)
send_event('powered', { value: powered_on_percent })
end
end
A corresponding dashboard configuration in place of the existing Synergy item will display it:
<li data-row="2" data-col="1" data-sizex="1" data-sizey="1">
<div data-id="powered" data-view="Meter" data-title="% Powered On" data-min="0" data-max="100"></div>
</li>
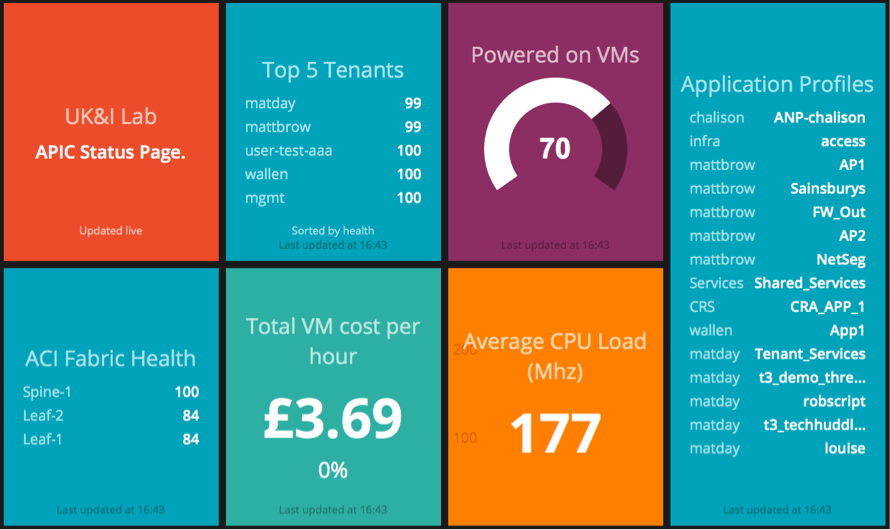
Output
The entire dashboard is now pulling information from UCS Director. The examples shown will update frequently and provide a gorgeous 10ft view of your estate.
Summary
As UCS Director provides a full Northbound API you can continue to add features and capabilities through the simple ruby scripts and building on these examples. We have added some additional examples as part of our Tech Huddle 2015 event and these can be found on GitHub:
https://github.com/CiscoUKIDCDev/Tech-Huddle-2015/tree/master/dashing
Find answers to your questions by entering keywords or phrases in the Search bar above. New here? Use these resources to familiarize yourself with the community:
