- Cisco Community
- Technology and Support
- Wireless - Mobility
- Wireless - Mobility Knowledge Base
- '802.11 Sniffer Capture Analysis -Wireshark filtering
- Subscribe to RSS Feed
- Mark as New
- Mark as Read
- Bookmark
- Subscribe
- Printer Friendly Page
- Report Inappropriate Content
- Subscribe to RSS Feed
- Mark as New
- Mark as Read
- Bookmark
- Subscribe
- Printer Friendly Page
- Report Inappropriate Content
05-28-2012 02:36 PM - edited 11-18-2020 02:58 AM
Introduction
'802.11 Sniffer Capture Analysis -Wireshark filtering
Wireshark Filtering-wlan
Objective
This document will help you in guiding how to set up the wireshark and analyze the interesting packets using a versatile tool within the wireshark program called the wireshark filters.
Prerequisites
The wireshark tool in itself will not help us in getting through the troubleshooting unless we have a good knowledge and understanding of the protocol , the topology of the network and which data points to consider taking sniffer traces. This is true for whether its for a wired or for wireless network where we capture the packets over the air before they are put on the network. The stripping of the wireless mac address is done by the by the AP.
Why do we need to capture wireless sniffer trace?
When we inspect a traffic or data on a wired network using wired sniffer trace and cant find our interesting packets we need to know where is it missing . Our suspicion may get us to verify if it even made it through the first point of the source of origination which being wireless is working fine or not or it being missed over the air. If it did not make it correctly over the air then will obviously be missing or not get translated or sent over over to the wired side by the AP to the DS or distribution system. It then becomes critical for us identify and localize the wireless network issue using wireless sniffer trace.
Why do we need to use wireless sniffer capture filter?
When it comes to troubleshooting network related issues there are many dependencies and all work in layered model and each layer data depend on its lower layer below it . There are many components or network elements and configuration and proper operation of the devices helps us achieve a smooth running network. When a working network stops functioning a logical approach is required to localize the issue. Once identified still the exact point of failure is difficult to find. Those situations sniffer comes to our aid. Since this troubleshooting process can become so complicated despite using the best approach and having a good understanding and troubleshooting skills. The problem is that if you capture the packets traveling through a network device we may end having huge file and may even end up to 1G if you capture long enough with lot packets details in it. With the such a large amount of overwhelming data it may be very time-consuming to pin point the problem and gets practically a very difficult task almost tending to impossible.
Filtering comes to our rescue to help a good troubleshooting engineer to spot the problems quickly by eliminating the unwanted traffic cutting the variables to a few or minimum variables to focus on at one time. This will help in quickly finding whether the interesting traffic is present or absent from the traffic collected. Use of filters then becomes an art and complements the troubleshooters skill greatly
It enhances the time to resolution rapidly hence the need to understand how to use the wireshark filtering.
- DISPLAY FILTERS – after you capture a lot of information, they help you to visualize only the packets that you are interested in
- CAPTURE FILTERS – from the beginning you know what the packet of interest for you and capture only those packets
Filters for coloring the packets- this is used as a visual aid to enhance the display filter or capture filter or can be used just without any filter to just classify the many interesting packets as different colors for high level approach.
When to use DISPLAY FILTERS and CAPTURE FILTERS?
It is recommended to use the Capture filters, when you know what are you looking for and trying to verify that in a running traffic to that event is captured when run that for more than couple of hours in a heavy traffic environment. This will help in keeping the data collected to stay in a reasonable amount in terms of file size.
If we are at a point we are not sure what might be causing the issue and is more of a behavioral random nature of problem then run the packet capture for less time within the probable window of problem occurrence pattern, like one or two hours, capture all the traffic and then use Display filters to visualize only the information that you are searching for.
Besides the use of above one can see all the capture and use coloring rules to catch the attention of certain type of packets assigned different colors for easy sorting or distinguishing packet flow.
How to filter?
Lets get a good understanding of the various fields within a typical wireshark sniffer trace. By breaking it down and defining each field.
We will be focusing on 3 items which we need to understand to start using Filtering.
- Capture filter
- Display Filter
- Coloring rules Filter
Before we delve in to details, here is the example of the sniffer capture window for wireshark, let dissect.
MENU BAR

This is the called the Menu bar of the wire shark window
It contains the following items:
- File: This menu contains items to open and merge capture files, save / print / export capture
files in whole or in part, and to quit from Wireshark.
- Edit This menu contains items to find a packet, time reference or mark one or more
packets, handle configuration profiles, and set your preferences; (cut, copy, and paste
are not presently implemented).
- View This menu controls the display of the captured data, including colorization of
packets, zooming the font, showing a packet in a separate window, expanding and
collapsing trees in packet details
- Go This menu contains items to go to a specific packet.
- Capture This menu allows you to start and stop captures and to edit capture filters
- Analyze This menu contains items to manipulate display filters, enable or disable the
dissection of protocols, configure user specified decodes and follow a TCP stream.
- Statistics This menu contains items to display various statistic windows, including a summary
of the packets that have been captured, display protocol hierarchy statistics and much
more.
- Telephony This menu contains items to display various telephony related statistic windows,
including a media analysis, flow diagrams, display protocol hierarchy statistics and
much more.
- Tools This menu contains various tools available in Wireshark, such as creating Firewall
ACL Rules.
- Internals This menu contains items that show information about the internals of Wireshark.
- Help This menu contains items to help the user, e.g. access to some basic help, manual
pages of the various command line tools, online access to some of the webpages,
and the usual about dialog.
The Main TOOL BAR

The main toolbar provides quick access to frequently used items from the menu. This toolbar cannot be customized by the user, but it can be hidden using the View menu, if the space on the screen is needed to show even more packet data. As in the menu, only the items useful in the current program state will be available. The others will be greyed out (e.g. you cannot save a capture file if you haven't loaded one).
The "Filter" toolbar

The filter toolbar lets you quickly edit and apply display filters
- Filter: Brings up the filter construction dialog, , “The
"Capture Filters" and "Display Filters" dialog boxes”.
Filter input the area to enter or edit a display filter string expressions. A syntax check of your filterstring is done while you are typing. The background will turn red if you enter an incomplete or invalid string, and will become green when you enter a valid string. You can click on the pull down arrow to select a previously-entered filter string from a list. The entries in the pull down list will remain available even after a program restart.
- Note:After you've changed something in this field, don't forget to press the Apply button (or the Enter/Return key), to apply this filter string to the display. This field is also where the current filter in effect is displayed.
- Expression: The middle button labeled "Add Expression..." opens a dialog box that lets you edit a display filter from a list of protocol fields, described in, “The "Filter Expression" dialog box”
- Clear Reset the current display filter and clears the edit area.
- Apply Apply the current value in the edit area as the new display filter.
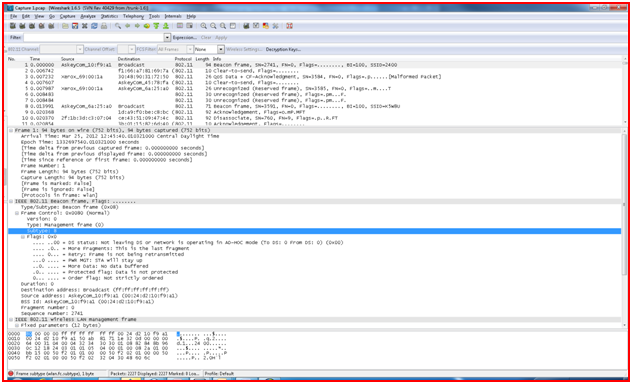
The "Packet List" pane
The packet list pane displays all the packets in the current capture file.
Each line in the packet list corresponds to one packet in the capture file. If you select a line in this pane, more details will be displayed in the "Packet Details" and "Packet Bytes" panes.
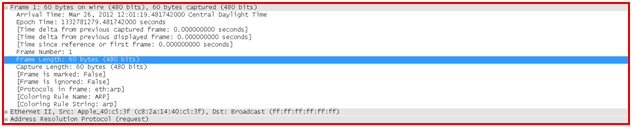
The "Packet Details" pane
The packet details pane shows the current packet (selected in the "Packet List" pane) in a more detailed form.
The "Packet Bytes" pane
The packet bytes pane shows the data of the current packet (selected in the "Packet List" pane) in a
hexdump style.

The Statusbar
The statusbar displays informational messages. In general, the left side will show context related information, the middle part will show the current number of packets, and the right side will show the selected configuration profile. Drag the handles between the text areas to change the size
The initial Statusbar
This statusbar is shown while no capture file is loaded, e.g. when Wireshark is started.

The context menu (right mouse click) of the tab labels will show a list of all available pages. This can be helpful if the size in the pane is too small for all the tab labels.
The Statusbar

The status bar displays informational messages. In general, the left side will show context related information, the middle part will show the current number of packets, and the right side will show the selected configuration profile. Drag the handles between the text areas to change the size.
The Status bar with a loaded capture file
- The colorized bullet on the left shows the highest expert info level found in the currently loaded capture file. Hovering the mouse over this icon will show a textual description of the expert info level, and clicking the icon will bring up the Expert Infos dialog box.
- The left side shows information about the capture file, its name, its size and the elapsed time while it was being captured.
- The middle part shows the current number of packets in the capture file. The following values are displayed:
- Packets: the number of captured packets
- Displayed: the number of packets currently being displayed
- Marked: the number of marked packets
- Dropped: the number of dropped packets (only displayed if Wireshark was unable to capture all packets)
- Ignored: the number of ignored packets (only displayed if packets are ignored)
- The right side shows the selected configuration profile. Clicking in this part of the statusbar will bring up a menu with all available configuration profiles, and selecting from this list will change the configuration profile.
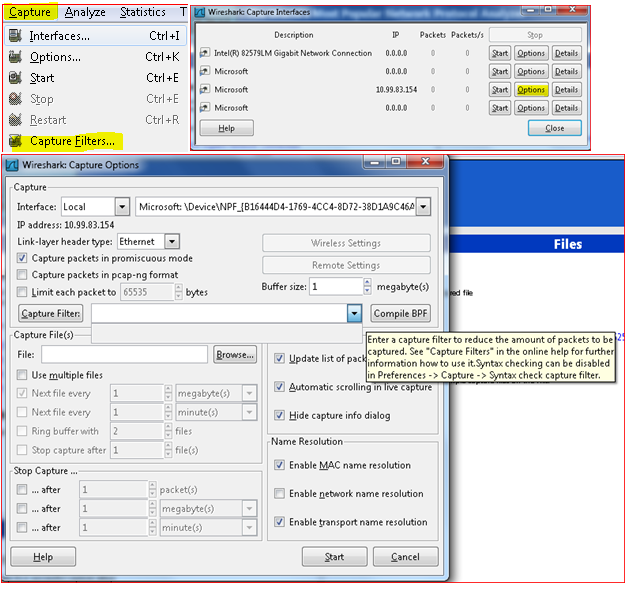
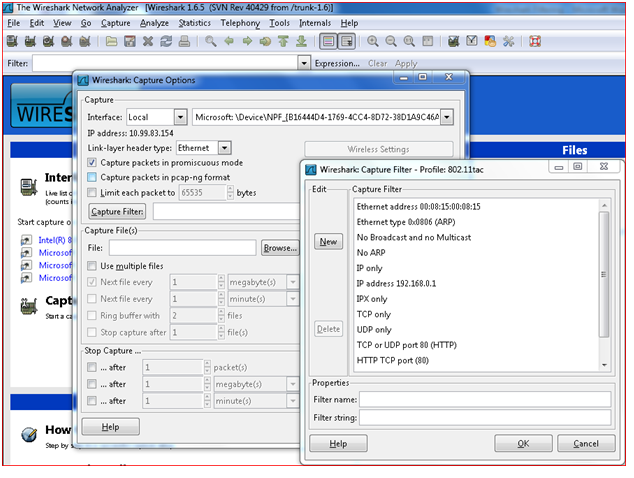
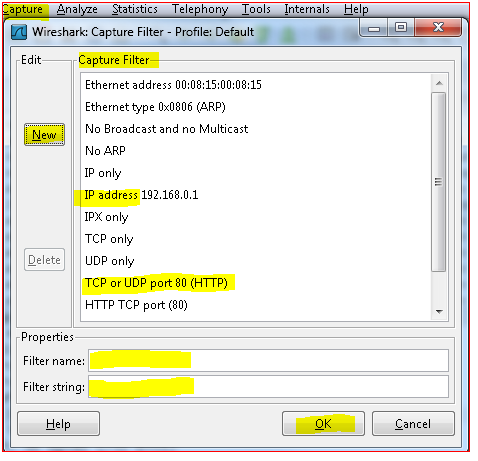
Using Capture filters
Click on “CAPTURE” , “INTERFACES” options and choose the Network adapter from drop down menu which will be used to capture running packets in the network on the PC. Click on the “CAPTURE FILTERS” and enter the filter name and Filter string or directly input the filter string you know in the box. Then hit ![]() button. Now the wire shark sniffer program captures packets which are of interest to you only among the huge flow of real time packets of all types of protocols .
button. Now the wire shark sniffer program captures packets which are of interest to you only among the huge flow of real time packets of all types of protocols .
Display Filter
Once you have the captured file loaded you now set up filters to display packets you are interested in looking or avoid seeing packets not interested . This can be done by using simple filter expression or a combination of expression using logical operators to form a complex filer string.
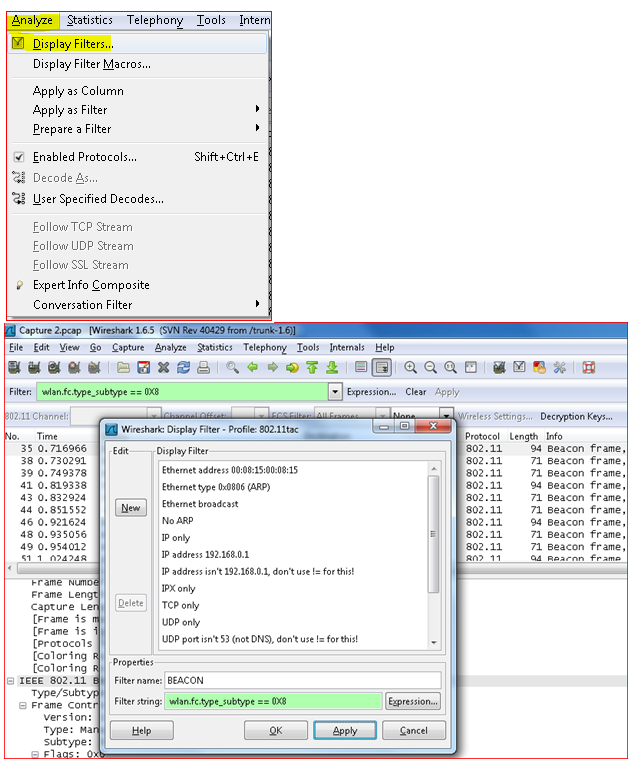
Click on “ANALYZE” Select “DISPLAY FILTER” .
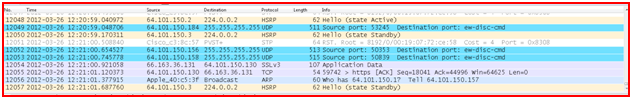
In the example below we are creating a filer to filter out the only the BEACON packets from a 802.11 wireless packet capture trace as seen below In the yellow highlighter.
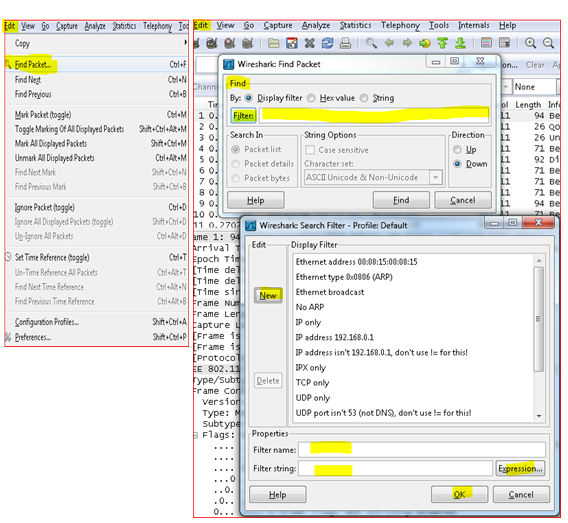
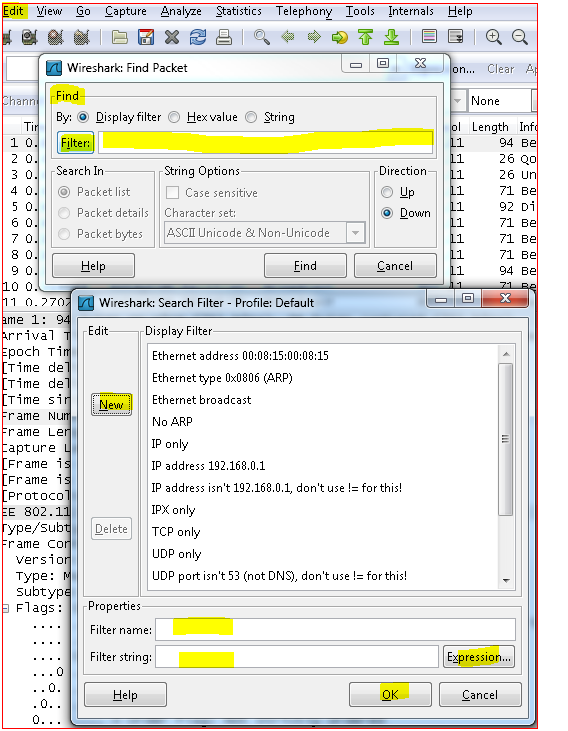
Similar to the display filter we can find a particular packet by applying filter after clicking “Find packet”
Find FILTER  button and entering the filter value in the filter box, if you don't know the string then you can dig further by clicking
  and hit NEW button and naming the filter strings and applying or typing the filter string with in the box. If you don't know the specific filter spring you can form it by choosing the EXPRESSION button which has various protocol option .
Select the one you are looking, expand and you will get more options to select from.
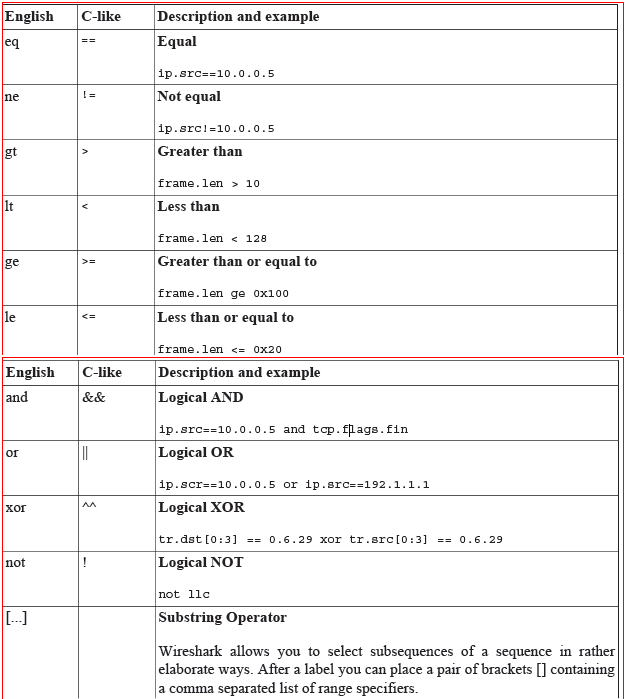
You will also have a Logical operator box to choose from to use to match to input the value you want to put and apply completing the filter.
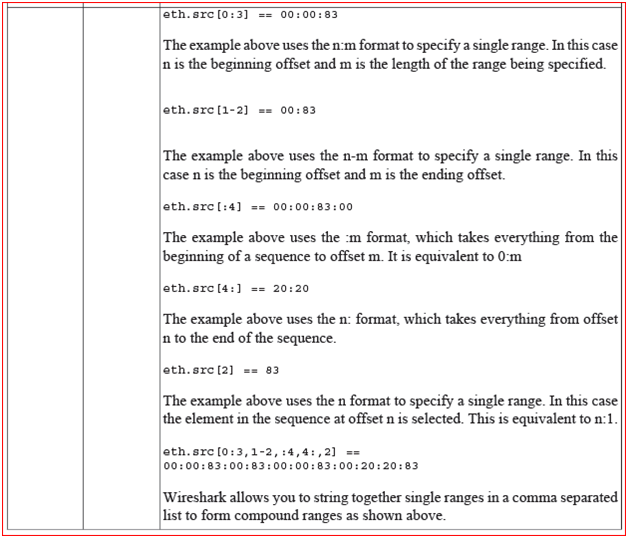
You can build display filters that compare values using a number of different comparison operators.
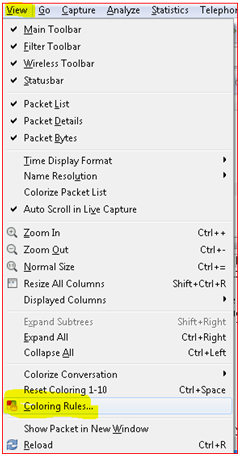
Using Coloring filter rule
A very useful mechanism available in Wireshark is packet colorization. You can set-up Wireshark so that it will colorize packets according to a filter. This allows you to emphasize the packets you are (usually) interested in
You can set-up Wireshark so that it will colorize packets according to a filter you choose to create. This allows you to emphasize the packets you are (usually) interested in.
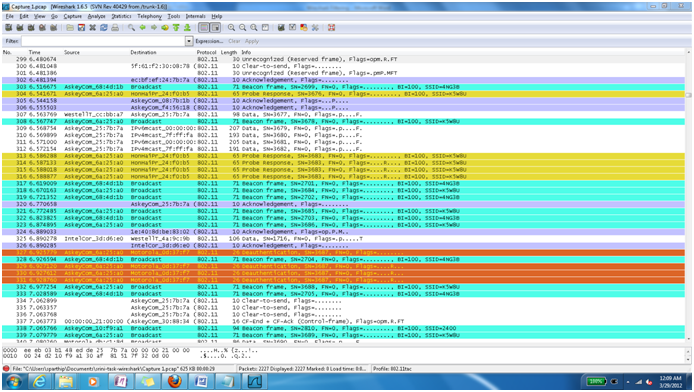
In the example below the packets are colorized for Beacons, Acknowledgement, probe Response, Deauthentication based on the filters mentioned below.
Click on  Select
  or use
 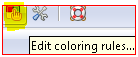 this from the main tool bar.
This opens the coloring rules and we can add a new coloring filter using  or the
  select the packet or edit the filter string and assign or adjust the color desired.
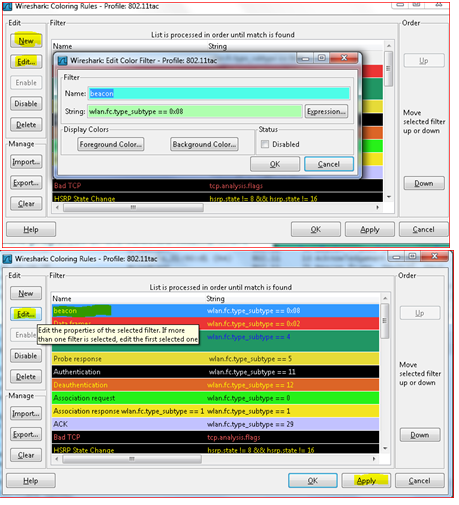
In the Edit Color dialog box, simply enter a name for the color filter, and enter a filter string in the
Filter text field. , “The "Edit Color Filter" dialog box” shows the values beacon and wlan.fc.type_subtype == 8 which means that the name of the color filter is Beacon and the filter will select protocols of type wlan.fc.type_subtype == 8 which is the beacon filter string. Once you have entered these values, you can choose a foreground and background color for packets that match the filter expression. Click on Foreground color... or Background color... to achieve this.
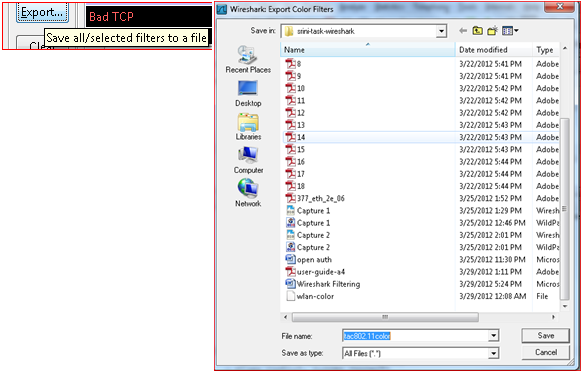
A very useful feature is to export or form the coloring filter and save it by exporting the filter to a file “ tac80211color” as seen below this can be imported , you can create multiple coloring rule files in your troubleshooting folder and use it as a template to your convenience every time you troubleshoot.
You can think innovatively and tailor make coloring filter template files such as routing, wlan, switching etc. Color filters files and just import them depending on the problem you are troubleshooting very easily.
There is a good coloring rules download which you may download and use at https://supportforums.cisco.com/docs/DOC-23792
This is how the final look of the wireshark packets window looks like after color filter file
“ tac80211color” is imported and applied.
Find answers to your questions by entering keywords or phrases in the Search bar above. New here? Use these resources to familiarize yourself with the community: